அபிவிருத்தி
\"அபிவிருத்தி\" (Development) என்ற சொல்லை அரசியலிலும் சர்வதேச நிறுவனங்களிலும் செய்தித் தாள்களிலும் தினம் கேட்கிறோம். ஆனால் இதன் உண்மையான அர்த்தம் என்ன? வெறும் பணமா? நாட்டின் GDP உயர்வா? கட்டடங்கள், நெடுஞ்சாலைகள், கைபேசிகளா? இவை வளர்ச்சியின் ஒரு வெளிப்பாடு மட்டுமே. இவ்வலகில் (1) அபிவிருத்தியின் வரைவிலக்கணம், (2) குறிகாட்டிகள் (indicators): பொருளாதார, சமூக, சுற்றுச்சூழல் குறிகாட்டிகள், (3) HDI, GDP, PQLI, (4) developed, developing நாடுகளுக்கிடையிலான வேறுபாடு, (5) sustainable development ஆகியவற்றைப் பார்ப்போம்.
1. அபிவிருத்தி (Development) என்றால் என்ன?
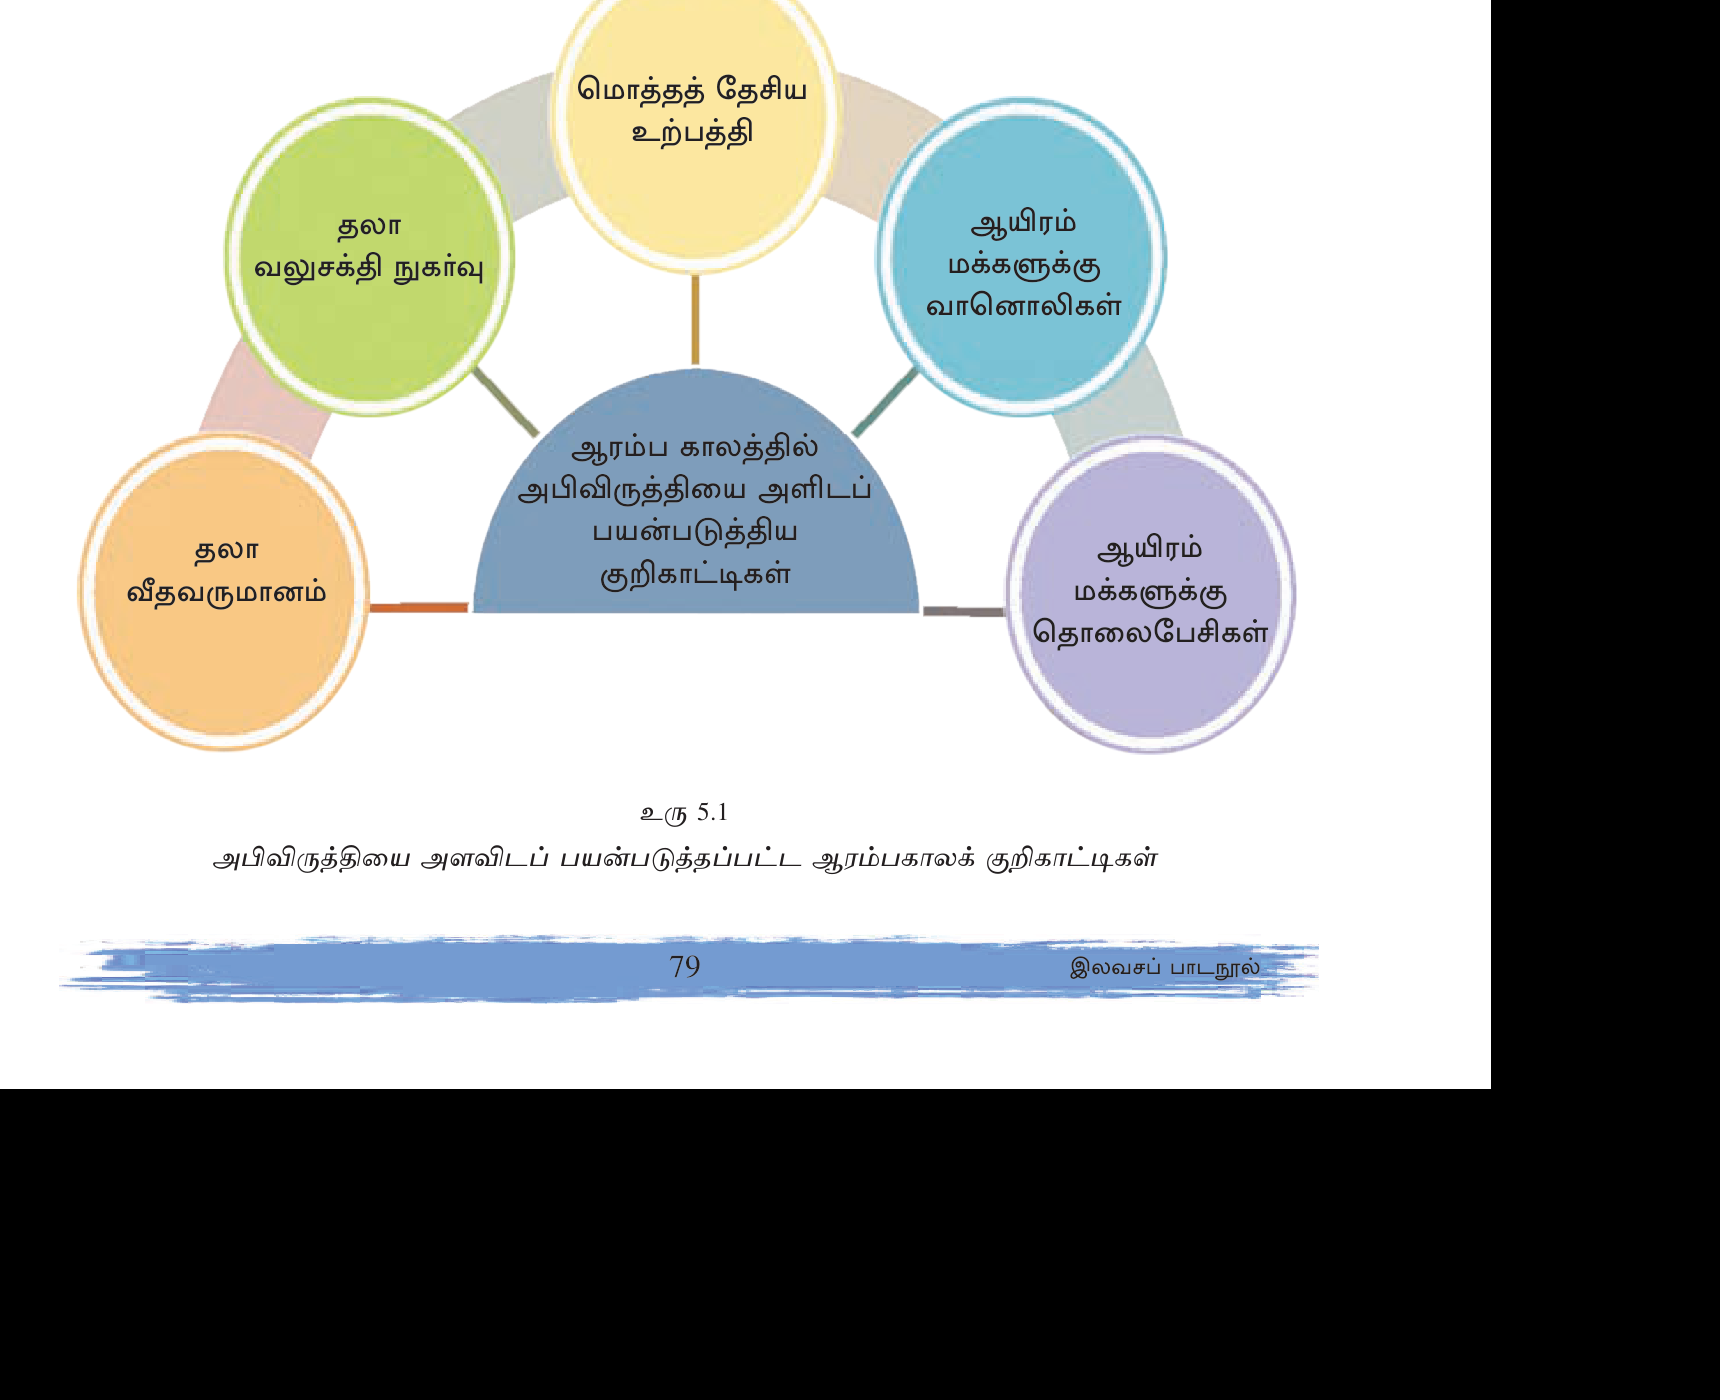
20-ம் நூற்றாண்டின் ஆரம்பத்தில் \"அபிவிருத்தி\" என்பது வெறும் பொருளாதார வளர்ச்சி (economic growth) எனப் புரிந்து கொள்ளப்பட்டது: GDP/GNP உயர்வு, தொழில்மயமாதல், போக்குவரத்து விரிவு. ஆனால் 1970-80களில் வளரும் நாடுகளில் GDP உயர்ந்தாலும் ஏழ்மை, ஊட்டக்குறை, கல்வி, மருத்துவப் பற்றாக்குறை தொடர்வதைக் கண்டு இதன் அர்த்தம் விரிவாக்கப்பட்டது.
நவீன வரைவிலக்கணம் (UNDP, 1990): அபிவிருத்தி என்பது மக்களின் வாழ்க்கைத் தரத்தை மேம்படுத்தும் பல பரிமாண செயற்பாடு ஆகும். பொருளாதார வருமானம், சமூக நலம் (கல்வி, சுகாதாரம்), சுற்றுச்சூழல் பாதுகாப்பு, சமூகப் பாதுகாப்பு, அரசியல் சுதந்திரம் ஆகிய அனைத்தும் இணைந்ததே அபிவிருத்தி.
Amartya Sen இன் \"Development as Freedom\" (1999) நூலின்படி, மனிதனின் தேர்வுகளும் திறன்களும் (capabilities) வளர்க்கப்படுவதே அபிவிருத்தி. அதாவது வாழ்க்கையில் என்ன செய்ய விரும்புகிறோமோ அதைச் செய்யக்கூடிய சுதந்திரமும் திறனும் இருப்பதே அபிவிருத்தியாகும்.
2. பழைய பார்வையும் புதிய பார்வையும்
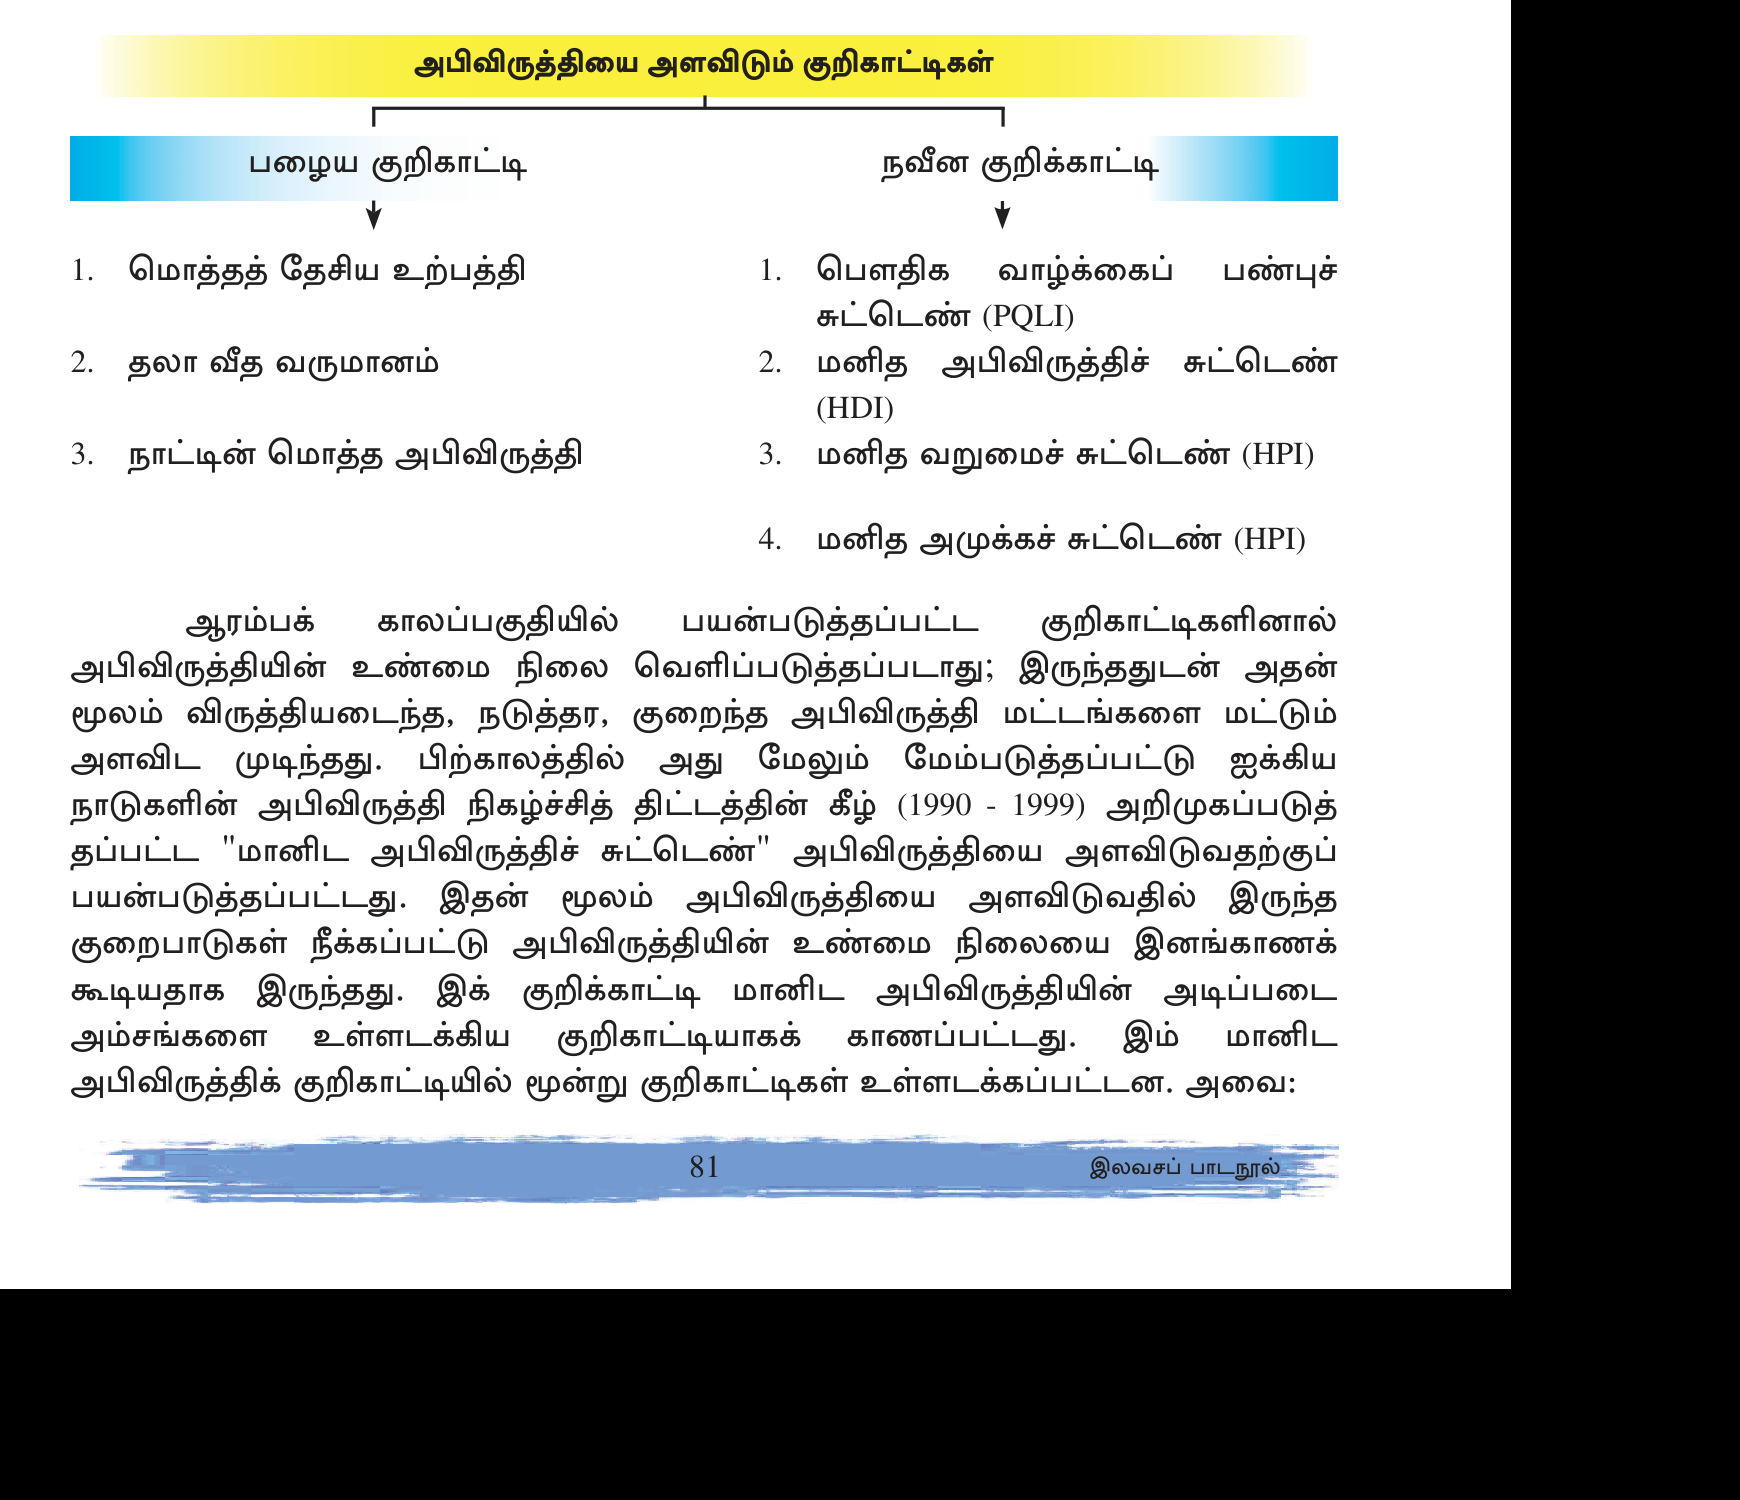
| Aspect | பழைய பார்வை (1950-70) | புதிய பார்வை (1980-) |
|---|---|---|
| முதன்மை அளவீடு | GDP/GNP | HDI உம் பல பரிமாணக் குறிகாட்டிகளும் (multi-dimensional) |
| நோக்கம் | பொருளாதார வளர்ச்சி | மக்கள் நலமும் சுதந்திரமும் |
| முதன்மை துறை | தொழில்மயமாதல் | கல்வி, சுகாதாரம், சுற்றுச்சூழல் |
| பிரச்சினை | வறுமை | inequality, sustainability, freedom |
| Approach | Top-down state plan | Bottom-up + community + market mix |
3. அபிவிருத்தி குறிகாட்டிகள் (Indicators)
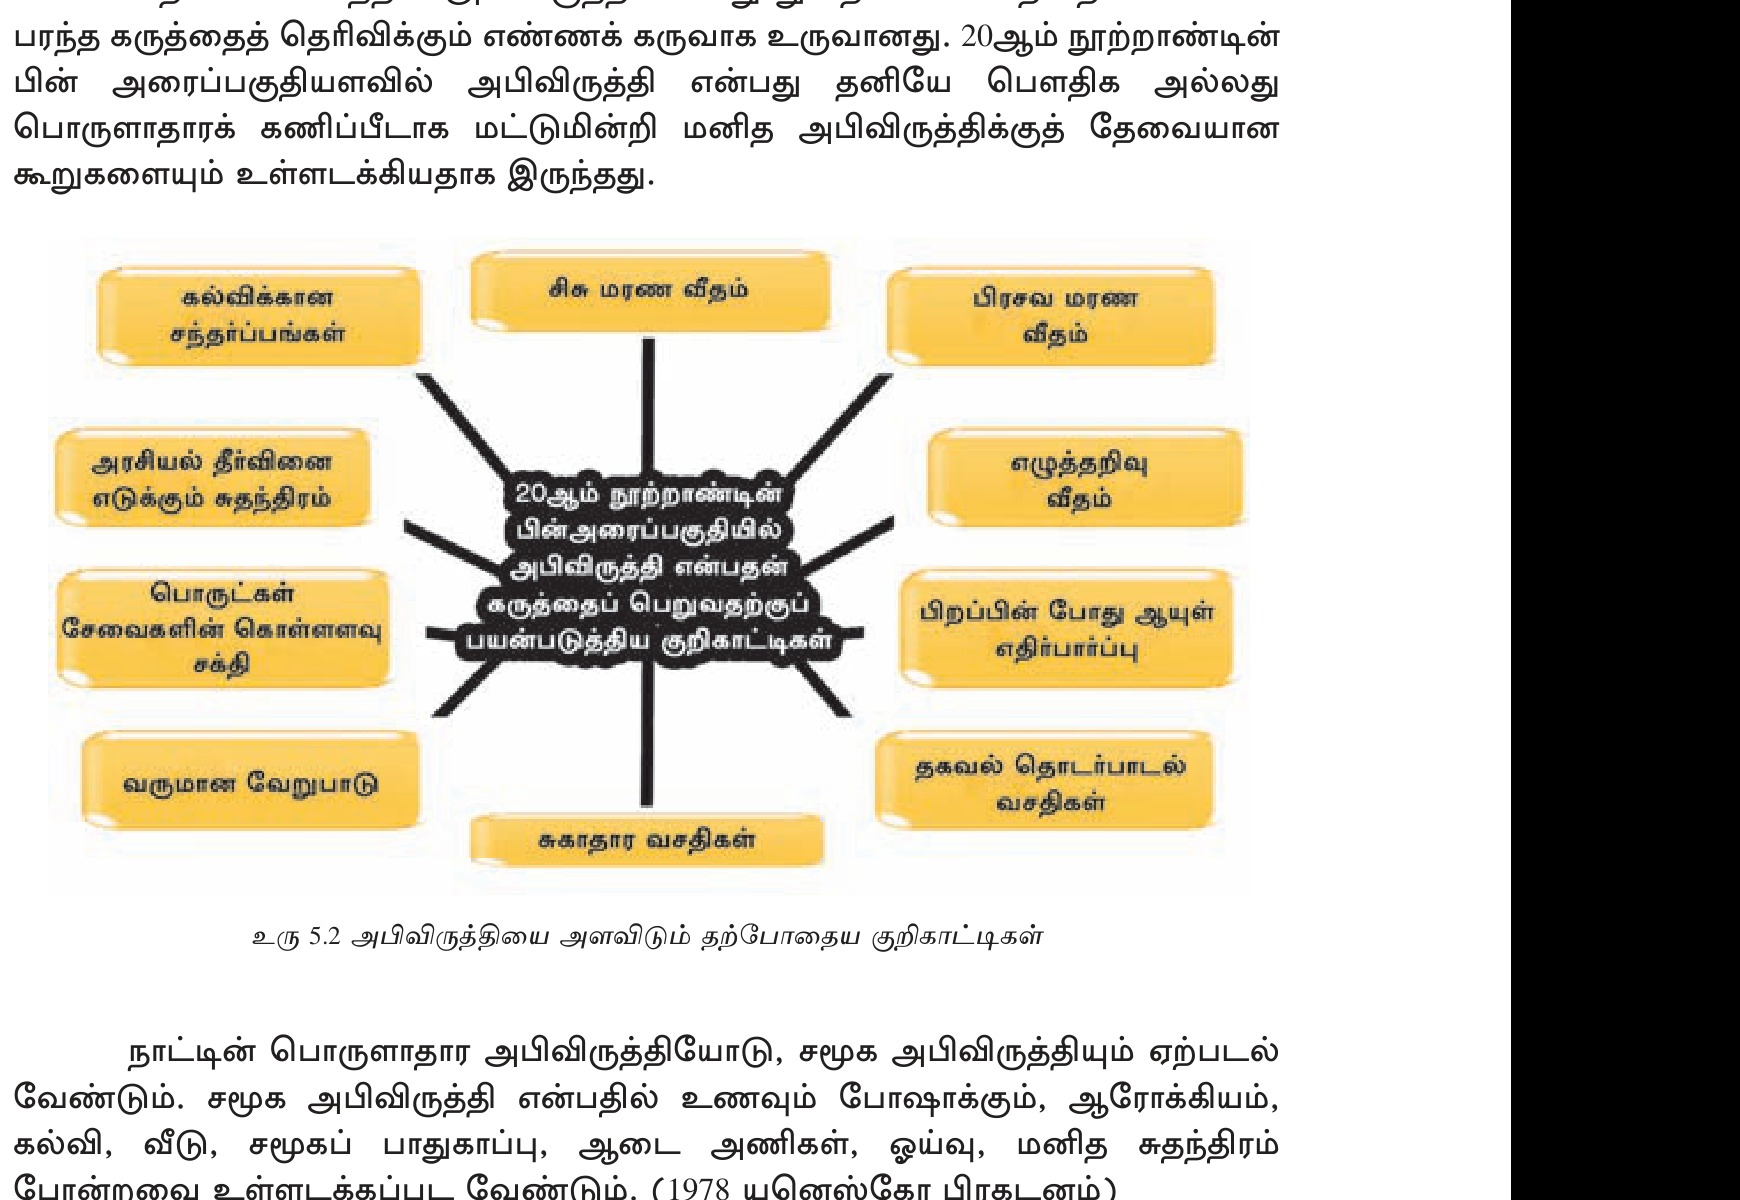
(அ) பொருளாதார குறிகாட்டிகள்
- GDP (Gross Domestic Product) — நாட்டின் மொத்த உள்நாட்டு உற்பத்தியின் மதிப்பு (USD). SL ~$80B.
- GNP / GNI (Gross National Product / Income) — GDP + net income from abroad. SL GNI/capita ~$3,800 (lower-middle).
- Per capita income — GDP ÷ population. USA ~$80k; SL ~$3.8k; Burundi <$300.
- Economic growth rate — % annual GDP increase. SL pre-2022 ~4-5%; 2022 = -7.8% crisis.
- Trade balance — exports vs imports.
- Inflation, unemployment, poverty headcount.
(ஆ) சமூக குறிகாட்டிகள் (Social Indicators)
- Life Expectancy at Birth: பிறக்கும்போது ஒருவர் எத்தனை ஆண்டுகள் வாழ்வார் என எதிர்பார்க்கப்படுகிறது. SL = 77; Japan 84; Sierra Leone 55.
- Infant Mortality Rate (IMR): 1000 பிறப்புகளுக்கு 1 வயதிற்குள் இறக்கும் குழந்தைகளின் எண்ணிக்கை. SL = 6/1000; Finland 2; Afghanistan 50.
- Literacy rate: 15+ வயதில் வாசிக்கவும் எழுதவும் தெரிந்தோரின் சதவீதம். SL = 93%; Niger 35%; Norway 100%.
- School enrollment — primary/secondary/tertiary.
- Access to clean water + sanitation.
- Doctors per 1000 people.
- Gender equality — Gender Development Index (GDI), Gender Inequality Index (GII).
(இ) சுற்றுச்சூழல் குறிகாட்டிகள் (Environmental Indicators)
- CO₂ emissions per capita — USA 14 tons; SL 1; Burkina Faso 0.2.
- Forest cover %.
- Renewable energy %.
- Air quality (PM2.5).
- Water stress indicator.
- Environmental Performance Index (EPI) — Yale + Columbia universities.
4. முக்கியமான கூட்டுச் சுட்டிகள் (Composite Indices)
HDI (Human Development Index)
UNDP சார்பில் 1990 இல் Amartya Sen, Mahbub ul Haq ஆகியோர் இதை உருவாக்கினர். இது 3 dimensions கொண்டது:
- Health — Life expectancy at birth.
- Knowledge — Expected + Mean years of schooling.
- Living standards — GNI per capita (PPP).
Index 0-1; categorised: Very High (>0.8), High (0.7-0.8), Medium (0.55-0.7), Low (<0.55). 2023 ranking: Switzerland #1 (0.967), Norway #2, Iceland #3. Sri Lanka #78 (0.78, High HDI). South Sudan, Chad, Niger lowest.
PQLI (Physical Quality of Life Index)
Morris David Morris 1979. 3 indicators (equal weight):
- Infant Mortality Rate
- Life Expectancy at age 1
- Literacy rate
Score 0-100. Simpler than HDI. India 1981 PQLI = 43; Kerala = 82 (despite low GDP — showed social development possible without high GDP).
GDP per capita (PPP) — Economic-only
PPP = Purchasing Power Parity = adjusted for cost of living. Better cross-country comparison than nominal.
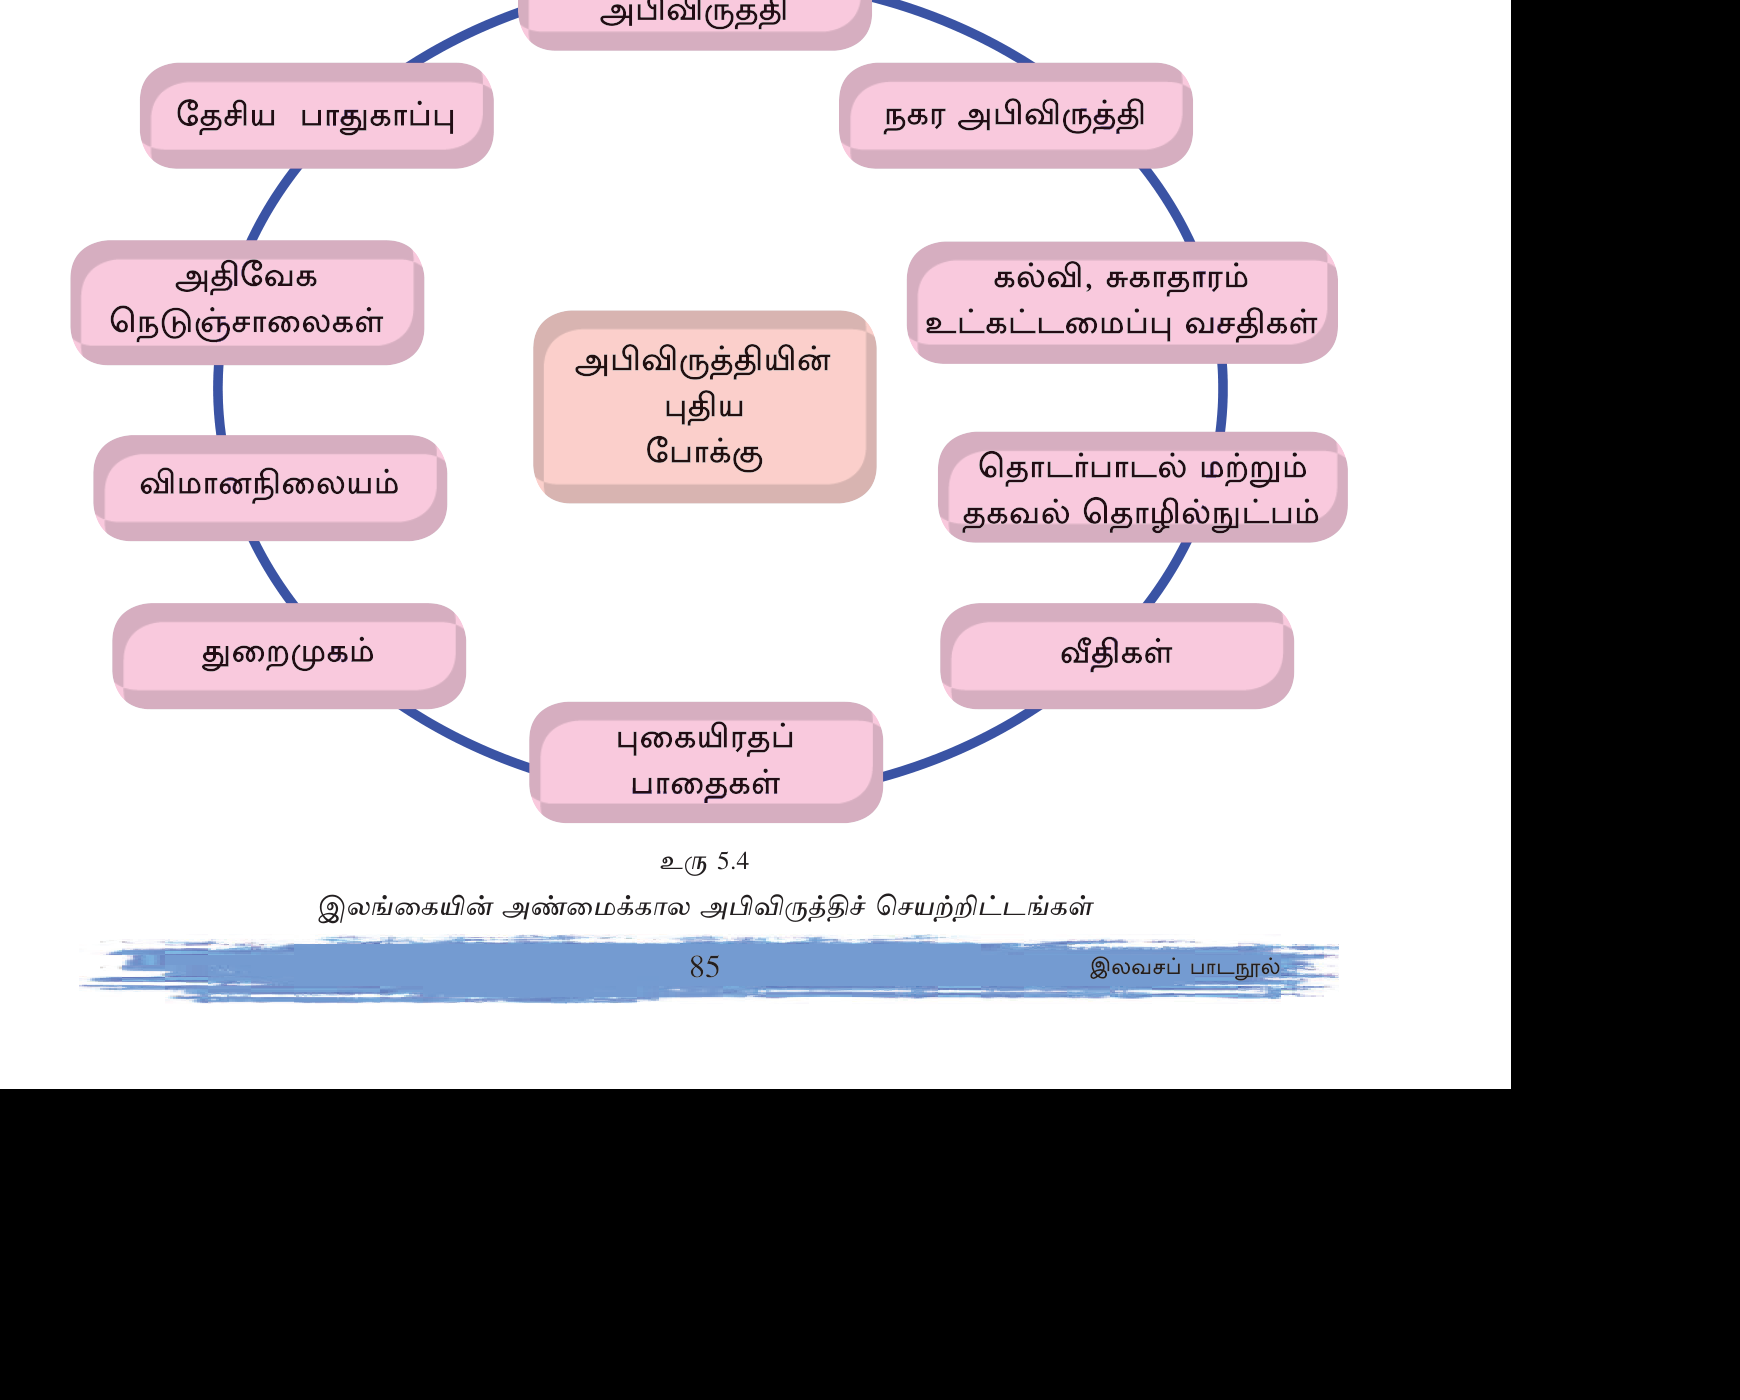
5. Developed vs Developing Countries
| பண்பு | Developed | Developing |
|---|---|---|
| GNI/capita | >$13,845 (WB 2024 threshold) | <$13,845 |
| HDI | >0.8 (Very High) | <0.7 typical |
| Life expectancy | 78-84 | 55-75 |
| Literacy | 100% | 40-90% |
| IMR (/1000) | 2-5 | 20-50+ |
| Urbanization | 80%+ | 30-60% |
| Industry | Manufacturing+services | Agriculture-dominant or transition |
| Population growth | 0-0.5% | 1-3% |
| Examples | USA, UK, Germany, Japan, Australia, Singapore, South Korea | India, Bangladesh, Nigeria, Indonesia, Vietnam, Ethiopia, Pakistan |
Intermediate categories: \"Emerging economies\" (China, India, Brazil, Indonesia, Mexico — fast-growing middle income); \"Least Developed Countries (LDCs)\" (UN classification — 46 countries; Burundi, Yemen, Mali, Madagascar). \"Newly Industrialised Countries (NICs)\" — South Korea, Taiwan, Singapore, Hong Kong (\"Asian Tigers\").
6. நிலையான அபிவிருத்தி (Sustainable Development)
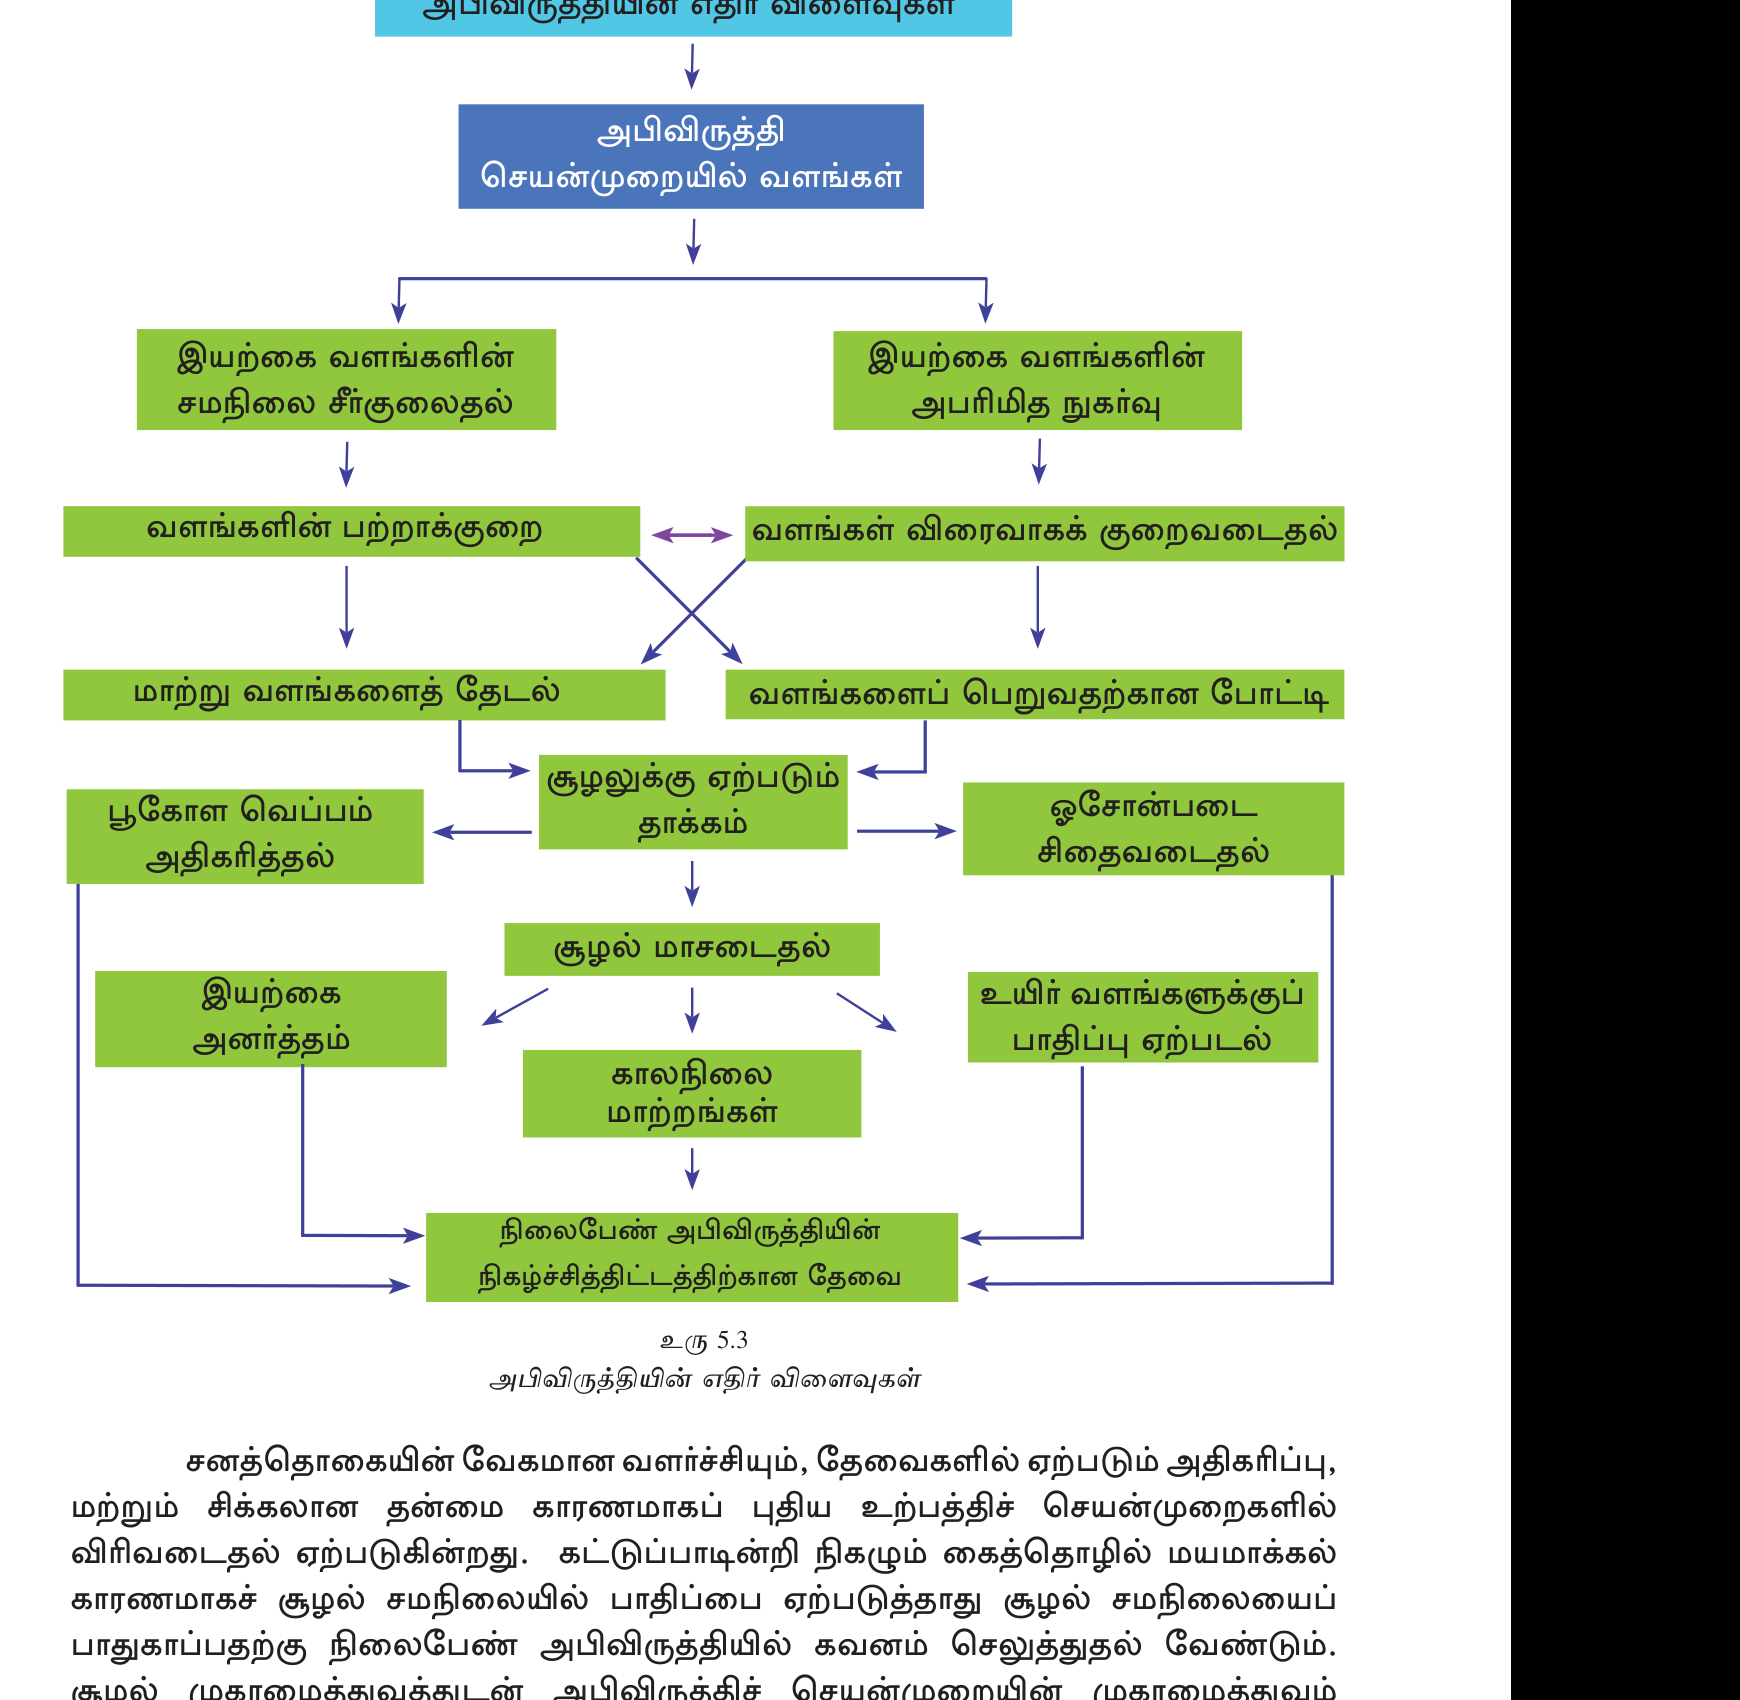
வரைவிலக்கணம் (Brundtland Commission, 1987): \"எதிர்காலத் தலைமுறைகளின் தேவைகளைப் பாதிக்காமல், இன்றைய தலைமுறையின் தேவைகளைப் பூர்த்தி செய்வதே.\"
3 தூண்கள் (Triple Bottom Line)
- Economic: பொருளாதார வளர்ச்சி, வேலை, வருமானம்.
- Social: சமூக சமத்துவம், கல்வி, சுகாதாரம், பாலின சமத்துவம் (gender equality).
- Environmental: இயற்கை வளப் பாதுகாப்பு, பல்லுயிர், காலநிலை.
மூன்றும் இணைந்தால் மட்டுமே sustainable ஆகும். ஒன்றை மட்டும் அதிகமாக நோக்கினால் (e.g. economic growth at any cost = environmental destruction) அது நீடிக்க முடியாததாகும்.
Sustainable Development Goals (SDGs, 2015-2030)
ஐக்கிய நாடுகளின் (UN) 17 universal goals ஆகும்; அவை 2015 New York summit இல் ஏற்றுக்கொள்ளப்பட்டன. இவை முந்தைய MDGs (Millennium Development Goals 2000-2015) இலக்குகளுக்குப் பதிலாக அமைந்தன.
- No Poverty
- Zero Hunger
- Good Health & Well-being
- Quality Education
- Gender Equality
- Clean Water & Sanitation
- Affordable & Clean Energy
- Decent Work & Economic Growth
- Industry, Innovation & Infrastructure
- Reduced Inequalities
- Sustainable Cities & Communities
- Responsible Consumption & Production
- Climate Action
- Life Below Water
- Life On Land
- Peace, Justice & Strong Institutions
- Partnerships for the Goals
Each goal has specific targets + indicators. Progress monitored by UN Statistics Division. 2030 deadline — current trajectory off-track for many goals.
7. அபிவிருத்திக்கான தடைகள் (Obstacles to Development)
- Geographic: climate (drought-prone), terrain (mountains), no coast access (landlocked), no resources.
- Economic: low capital, foreign debt, brain drain, inadequate infrastructure.
- Social: illiteracy, gender inequality, ethnic/religious conflict, caste/class structures.
- Political: instability, corruption, weak institutions, authoritarianism.
- Historical: colonial exploitation, slavery, conflict.
- External: unfair trade rules, IMF/WB conditionalities, geopolitical pressure.
- Environmental: climate change disasters, resource depletion.
8. அபிவிருத்தியை அடையும் வழிமுறைகள் (Approaches)
- Education + Health investment — long-term human capital.
- Infrastructure — roads, electricity, broadband.
- Industrial policy — manufacturing, export promotion, FTZ.
- Agricultural modernization — Green Revolution, irrigation.
- Foreign direct investment (FDI) attraction.
- Good governance — rule of law, anti-corruption.
- Women's empowerment — education, work, political participation.
- Environmental protection — sustainable resource use.
- Regional integration — SAARC, ASEAN.
- Development = multi-dimensional (economic + social + environmental).
- Indicators: Economic (GDP/GNI/income) + Social (life expectancy, IMR, literacy) + Environmental (CO₂, forest, EPI).
- HDI: UNDP 1990; 3 dimensions (Health + Knowledge + Living standards). SL HDI 0.78 (High). Switzerland #1.
- PQLI: 3 indicators (IMR + Life expectancy + Literacy). Morris 1979.
- Developed vs Developing thresholds: GNI >$13,845; HDI >0.8.
- Brundtland 1987: \"meet present needs without compromising future generations.\"
- SDGs 2015-2030: 17 goals (Climate Action = SDG 13).
- NICs: S. Korea, Taiwan, Singapore, Hong Kong (\"Asian Tigers\").
- LDCs: 46 UN-classified least developed nations.
- "Development = GDP growth alone" — modern view is multi-dimensional.
- HDI vs PQLI: HDI 3 dim (health/knowledge/income); PQLI 3 indicators (IMR/life exp/literacy). Different.
- "Developing = poor" — developing includes wide range (Nigeria $2k vs Mexico $10k both developing).
- GNI ≠ GDP. GNI includes foreign income; GDP only domestic.
- "Sustainable = environmental only" — also includes economic + social.
- "SDG 2015-2030" — replaced MDGs (2000-2015), not in addition.
- "NICs = Newly Industrialised Countries" = specifically Asian Tigers; not generic.
✅ விரைவுச் சோதனை
முக்கியக் கருத்துக்களை உறுதிப்படுத்துங்கள். தவறான விடைகள் உங்கள் தவறுக் குறிப்பேட்டில் சேமிக்கப்படும்.
🖊 கட்டுரை வினாக்கள் (பகுதி II)
பரீட்சை வடிவில் கட்டமைப்பு வினாக்கள். முதலில் நீங்களே எழுதுங்கள்; பின்னர் மாதிரி விடையைத் திறந்து சரிபாருங்கள்.
விடைத் திட்டம் — சேர்க்க வேண்டிய புள்ளிகள்:
- Old: GDP/industrial growth
- New (UNDP 1990): multi-dim well-being
- Sen: capabilities + freedoms
- Economic: GDP/GNI/income/growth
- Social: life exp/IMR/literacy
- Environmental: CO2/forest/EPI
- Composite: HDI/PQLI
**பழைய பார்வை (1950s-70s):** WW2-க்குப் பின் Marshall Plan-ன் வெற்றியும், Soviet 5-year plan industrialization-ம் ஐரோப்பா-USA-ஐ "developed" என்றும், மற்றவை "underdeveloped/developing" என்றும் வகைப்படுத்தியது. முக்கிய அளவீடு **GDP growth** + **industrialization** + **infrastructure**. நோக்கம்: "catching up to West." Truman President's 1949 inaugural address articulated "development assistance" concept.
Top-down state planning, foreign aid, large dams/factories/highways. Rostow's "Stages of Economic Growth" (1960) — traditional society → preconditions → take-off → maturity → mass consumption. India 5-year plans, China 5-year plans similar.
**1970s-80s critique:** Despite GDP growth, vast populations remained poor, illiterate, sick. Brazil "economic miracle" 1968-73 (GDP +10%) but inequality + poverty deepened. Pakistan, Mexico, Nigeria — GDP up, malnutrition up. Critique: GDP measured wealth but not welfare; missed distribution + non-economic dimensions.
**நவீன பார்வை (1980s onwards):**
**Mahbub ul Haq + Amartya Sen (UNDP 1990)** introduced **Human Development Index (HDI)** — first widely-used multi-dimensional measure:
- Health (life expectancy)
- Knowledge (years of schooling)
- Living standards (GNI/capita PPP)
**Amartya Sen's "Development as Freedom" (1999):** Development = expanding people's substantive freedoms / capabilities to live lives they value. Not just wealth but ability to be educated, healthy, politically participate, choose careers. Famine = not just food shortage but failure of entitlements.
**Brundtland 1987:** Added sustainability — present needs without compromising future. Three pillars.
**SDGs 2015-2030 (17 goals):** consolidated multi-dimensional view officially globally.
**Indicators — Detailed:**
**(அ) Economic Indicators:**
- **GDP (Gross Domestic Product):** total value of goods + services produced within country. SL ~$80B.
- **GNI (Gross National Income):** GDP + net income from abroad. SL ~$75B; per capita ~$3,800.
- **PPP-adjusted GNI:** purchasing power parity adjusts for cost of living. Better cross-country comparison.
- **GDP growth rate:** annual %. China 1990-2010 ~10%/yr; SL pre-2022 ~5%; 2022 = -7.8%.
- **Per capita income:** GDP ÷ population. USA $80k; SL $3.8k; Burundi $200.
- **Inflation, unemployment, poverty headcount (% below $2.15/day), Gini coefficient (inequality).**
**(ஆ) Social Indicators:**
- **Life Expectancy at Birth:** Japan 84, SL 77, Niger 60, Sierra Leone 55.
- **Infant Mortality Rate (IMR):** Finland 2/1000, SL 6/1000, Afghanistan 50, Sierra Leone 80. Strongest single development indicator.
- **Literacy rate (15+):** SL 93%, Norway ~100%, India 74%, Niger 35%.
- **School enrollment** — primary (basic), secondary, tertiary.
- **Access to clean water + sanitation** (SDG 6).
- **Doctors + nurses per 1000.**
- **Gender Development Index (GDI), Gender Inequality Index (GII).**
- **Mean years of schooling.**
**(இ) Environmental Indicators:**
- **CO₂ emissions per capita:** USA 14 tons, Qatar 37, EU avg 6, India 1.9, SL 1, Burkina Faso 0.2.
- **Forest cover %:** Finland 73%, Bhutan 71%, SL 29%, Bangladesh 11%.
- **Renewable energy %.**
- **Air quality (PM2.5).**
- **Water stress index** (UN-FAO).
- **Environmental Performance Index (EPI)** — Yale + Columbia annual.
- **Ecological Footprint** — Global Footprint Network.
**Composite Indices:**
- **HDI:** Health + Knowledge + Living. 0-1. SL 0.78 High; Switzerland #1 (0.967).
- **PQLI:** IMR + Life expectancy at 1 + Literacy. 0-100. Morris 1979.
- **Inequality-adjusted HDI (IHDI):** HDI penalized for inequality.
- **Multidimensional Poverty Index (MPI):** UN — 10 indicators across 3 dimensions.
- **Happy Planet Index (HPI):** well-being + life expectancy + ecological footprint.
இவ்வாறு பழைய GDP-centric → நவீன holistic multi-dimensional + sustainable view-ஆக evolved.
விடைத் திட்டம் — சேர்க்க வேண்டிய புள்ளிகள்:
- Brundtland 1987 definition
- 3 pillars: Economic + Social + Environmental
- MDGs 2000-2015 (8 goals) preceded
- SDGs 2015-2030 (17 goals)
- Examples: Costa Rica 99% renewable; Bhutan carbon-negative; Norway EVs
- Challenges: trade-offs, financing, COVID setback
- Trends: green economy, circular economy, ESG
**3 Pillars (Triple Bottom Line):**
1. **Economic (Profit):** prosperity, growth, jobs, innovation. Without economic capacity, social + environmental goals lack funding. But growth shouldn't externalize costs.
2. **Social (People):** equity, education, health, gender equality, social cohesion, indigenous rights, justice. Development must benefit all, not few.
3. **Environmental (Planet):** clean air, water, biodiversity, climate stability, sustainable resource use. The basis of all human activity.
**Pillars must balance.** Excessive focus on one undermines others — e.g. China rapid economic growth caused environmental devastation; Soviet planning caused social repression.
**Visualization:** Often shown as three overlapping circles; sustainability = intersection. Or as concentric circles: environment encloses social, which encloses economic (because environment is foundational).
**History — From MDGs to SDGs:**
**MDGs (Millennium Development Goals, 2000-2015):** UN Millennium Summit 2000. 8 goals:
1. Eradicate extreme poverty & hunger
2. Universal primary education
3. Gender equality + empower women
4. Reduce child mortality
5. Improve maternal health
6. Combat HIV/AIDS, malaria, other diseases
7. Ensure environmental sustainability
8. Global partnership for development
MDG achievements: extreme poverty halved (1.9B → 836M), primary school enrollment up, gender gap closing. But uneven — sub-Saharan Africa lagged.
**SDGs (Sustainable Development Goals, 2015-2030):** Replaced MDGs at UN Sustainable Development Summit Sept 2015 ("Agenda 2030"). 17 goals, 169 specific targets:
1. **No Poverty**
2. **Zero Hunger**
3. **Good Health & Well-being**
4. **Quality Education**
5. **Gender Equality**
6. **Clean Water & Sanitation**
7. **Affordable & Clean Energy**
8. **Decent Work & Economic Growth**
9. **Industry, Innovation & Infrastructure**
10. **Reduced Inequalities**
11. **Sustainable Cities & Communities**
12. **Responsible Consumption & Production**
13. **Climate Action**
14. **Life Below Water**
15. **Life On Land**
16. **Peace, Justice & Strong Institutions**
17. **Partnerships for the Goals**
Key differences from MDGs:
- **Universal** — for ALL countries, not just developing.
- **Holistic** — integrates environment + economy + society.
- **More ambitious** — "eradicate" poverty, not just "reduce."
- **Indicators** — 232 indicators officially.
- **Accountability** — voluntary national reviews at HLPF (High-Level Political Forum).
**Country Examples:**
- **Costa Rica:** 99% electricity from renewables (hydro + geothermal + wind + solar). Carbon neutral target 2050. National parks 25% land.
- **Bhutan:** World's first carbon-negative country (forests absorb more CO₂ than emit). GNH (Gross National Happiness) policy framework — 4 pillars (sustainable dev + culture + environment + good governance).
- **Denmark:** 50%+ wind electricity; ambitious 70% emission reduction by 2030.
- **Norway:** 80%+ new car sales EVs (sovereign wealth fund + carbon tax). World's 1st HDI for years.
- **Iceland:** 85% renewable; geothermal heating; gender equality #1.
- **Singapore:** Green Plan 2030; vertical farming; smart city tech.
- **Sweden:** First country to set 1.5°C target law.
- **Rwanda:** Strong environmental policy post-genocide rebuilding; plastic bag ban; ICT-led leapfrog.
**Challenges:**
1. **Trade-offs:** economic growth vs environment (China's dilemma); cheap goods vs labour rights (Bangladesh garments).
2. **Financing gap:** SDGs need $2.5-3 trillion/year extra; developing countries cannot fund alone.
3. **COVID-19 setback (2020-22):** poverty rose, learning losses, healthcare strained, SDG indicators regressed.
4. **Climate crisis:** worsening weather, sea-level rise, refugees.
5. **Inequality:** global Gini rising; wealth concentration.
6. **Conflict:** Ukraine war, Gaza, Sudan disrupt SDG progress.
7. **Technology disruption:** AI, automation may displace workers faster than retraining.
8. **Geopolitical fragmentation:** US-China rivalry, slowing multilateralism.
**Emerging Concepts:**
- **Green economy:** decoupling growth from environmental damage.
- **Circular economy:** design out waste, reuse materials.
- **ESG (Environmental, Social, Governance) investing:** mainstream finance considers sustainability.
- **Net-zero by 2050:** ~140 countries pledged (UN Race to Zero).
- **Just transition:** climate action that protects workers + vulnerable.
- **Doughnut Economics:** Kate Raworth — between social foundation and ecological ceiling.
**Sri Lanka & SDGs:** Sustainable Development Council (PMD) coordinates. Strengths: high HDI, female education, healthcare access. Weaknesses: climate vulnerability, deforestation, marine pollution, inequality, 2022 crisis setback. UN Country Team supports.
விடைத் திட்டம் — சேர்க்க வேண்டிய புள்ளிகள்:
- Old: developed (West) vs developing (rest)
- Modern: high/upper-middle/lower-middle/low income (WB)
- HDI 4 categories: VHigh/High/Medium/Low
- Criteria: GNI/HDI/life exp/literacy/industry/urban
- Developed examples: USA/UK/Japan/Germany/Singapore
- Developing range: India/Bangladesh/Nigeria/Vietnam
- Intermediate: NICs (Asian Tigers), emerging (BRICS), LDCs (46 countries)
**Traditional Distinction:**
| Aspect | Developed | Developing |
|---|---|---|
| **GNI/capita** | > $13,845 (WB 2024 threshold) | < $13,845 |
| **HDI** | > 0.8 (Very High) | < 0.7 typical |
| **Life expectancy** | 78-84 | 55-75 |
| **Literacy** | ~100% | 40-93% |
| **IMR (/1000)** | 2-5 | 20-80 |
| **Urbanization** | 80%+ | 30-60% |
| **Industry structure** | Services 60-75% + Mfg 20-25% + Agri <5% | Agriculture 20-50% + Services + Industry |
| **Population growth** | 0-0.5% | 1-3% |
| **Demographic stage** | 4-5 | 2-3 |
| **Fertility** | <2 | 2-5 |
| **Tech adoption** | High | Variable |
| **Examples** | USA, UK, Japan, Germany, France, Australia, Canada, S.Korea, Singapore, Norway | India, Bangladesh, Nigeria, Indonesia, Vietnam, Mexico, Pakistan, SL, Ghana, Kenya |
**World Bank Income Classification (more nuanced):**
- **High Income:** > $13,845/yr — 86 economies. USA, EU, Japan, Australia, Israel, Korea, Saudi.
- **Upper-Middle Income:** $4,466-$13,845 — China, Brazil, Russia, Argentina, Turkey, Malaysia, Thailand.
- **Lower-Middle Income:** $1,136-$4,465 — India, SL, Vietnam, Indonesia, Philippines, Egypt, Nigeria.
- **Low Income:** < $1,135 — Burundi, Niger, DRC, Madagascar, Afghanistan, Yemen.
**UN Development Classification:**
- **Developed economies:** ~37 countries (WESP).
- **Economies in transition:** former Soviet bloc transitioning to market.
- **Developing economies:** rest.
- **LDCs (Least Developed Countries):** 46 countries (UN-defined by low income + weak human assets + economic vulnerability). Examples: Bangladesh (graduating 2026), Nepal, Ethiopia, Yemen, Somalia, Haiti.
**HDI Classification (UNDP):**
- **Very High HDI (> 0.8):** Switzerland, Norway, Iceland, HK, Australia, Denmark, Sweden — 66 countries.
- **High (0.7-0.8):** Sri Lanka (0.78), Mexico, Turkey, Russia, China, Thailand — 49 countries.
- **Medium (0.55-0.7):** India, Bangladesh, Bhutan, Indonesia, Honduras — 44 countries.
- **Low (<0.55):** Chad, Niger, S.Sudan, Burundi, Mali, Mozambique — 32 countries.
**Intermediate Categories:**
**(அ) NICs (Newly Industrialised Countries) / "Four Asian Tigers":**
S.Korea + Taiwan + Singapore + Hong Kong — 1960s-90s rapid industrialization. Strategy: export-oriented manufacturing, education investment, state-business cooperation, FDI attraction. Reached developed status. "Tiger Cubs" — Malaysia, Thailand, Philippines, Indonesia — follow-on growth.
**(ஆ) BRICS Emerging Economies:** Brazil, Russia, India, China, South Africa. Fast growth + large size; expanded 2024 (BRICS+) to UAE, Iran, Egypt, Ethiopia. Geopolitical alternative to G7. China + India = nearly 40% of global population.
**(இ) Asian + African "Lions":** Vietnam, Indonesia, Philippines, Ethiopia, Rwanda, Ghana — next wave high-growth markets.
**(ஈ) Petroleum-rich states:** Saudi Arabia, UAE, Qatar, Kuwait — high GNI per capita but uneven HDI (gender gaps, migrant labour rights). "Resource curse" risks.
**(உ) Post-Soviet transitional:** Russia, Belarus, Ukraine, Central Asian republics — market transition with mixed outcomes.
**(ஊ) Conflict-affected fragile states:** Yemen, Syria, Afghanistan, Somalia, S.Sudan, Haiti, Venezuela. Often HDI declining; humanitarian crises.
**Sri Lanka's Position:**
- **WB:** Lower-middle income ($3,800/capita) — was upper-middle briefly before 2022 crisis.
- **HDI:** High (0.78, rank #78). South Asia's highest after Maldives.
- **Demographic:** Stage 3-4 transitional, aging.
- **Economy:** services 58%, industry 30%, agriculture 12%. Diversified but small.
- **Strengths:** female education, healthcare, life expectancy 77.
- **Weaknesses:** debt crisis, brain drain, ethnic divides, narrow export base.
**Critiques of "Developed/Developing" Binary:**
1. **Static labels:** Masks continuous change. China was "developing" 1980 — now upper-middle. South Korea was "developing" 1960 — now developed.
2. **Heterogeneity within categories:** "Developing" includes both Nigeria ($2K) and Mexico ($10K) — vast differences.
3. **Multiple dimensions:** A country can be rich (UAE) but low on gender equality; or moderate income (Costa Rica) but high environmental performance.
4. **Colonial baggage:** "Underdeveloped" implies inferiority; "developing" assumes Western model as endpoint.
5. **WB has dropped binary** in publications since 2016 — uses income classifications.
6. **"Global South vs Global North"** — alternative geographic framing, also imperfect.
**Modern usage:** Many institutions now prefer specific indicators ("low-income countries", "emerging markets", "high HDI") over binary terms. SL self-describes as "middle-income developing nation."
🔥 மீட்டல் மையம்
பரீட்சைக்கு முன் இறுதி ஒரு நிமிடம் — மறக்கக்கூடாதவை மட்டும்.
- <b>Development = multi-dimensional</b> well-being (economic + social + environmental + freedom).
- <b>Old view:</b> GDP/industrial growth only. <b>New view (UNDP 1990):</b> HDI multi-dim.
- <b>Amartya Sen (1999) "Development as Freedom"</b> — capabilities approach.
- <b>Indicators 3 types:</b> Economic (GDP/GNI/income/growth) · Social (life exp/IMR/literacy) · Environmental (CO₂/forest/EPI).
- <b>HDI</b> (UNDP 1990) — 3 dim: Health (life exp) + Knowledge (schooling) + Living (GNI). Scale 0-1.
- <b>HDI categories:</b> Very High >0.8 · High 0.7-0.8 (<b>SL=0.78</b>) · Medium 0.55-0.7 · Low <0.55.
- <b>PQLI</b> (Morris 1979) — IMR + Life exp at 1 + Literacy. Scale 0-100.
- <b>Sustainable Development:</b> Brundtland 1987 — "meet present needs without compromising future."
- <b>3 pillars:</b> Economic + Social + Environmental.
- <b>SDGs 2015-2030:</b> 17 goals (replaced MDGs 2000-2015 8 goals).
- <b>NICs:</b> S.Korea + Taiwan + Singapore + HK (Asian Tigers).
- <b>LDCs:</b> 46 UN-classified least developed countries.
அலகின் முதுகெலும்பு — கருத்துக்களும் தொடர்புகளும்.
- <b>HDI 3 dimensions - detailed:</b> Health = Life Expectancy at Birth. Knowledge = Expected Years + Mean Years of Schooling. Living = GNI per capita PPP. Geometric mean of 3 → composite. Switzerland #1 (0.967); SL #78 (0.78 High); Chad/Niger/S.Sudan lowest (<0.45).
- <b>PQLI - detailed:</b> Morris David Morris 1979 (Overseas Development Council). 3 equal-weight indicators: IMR + Life expectancy at age 1 + Literacy. Scale 0-100. Kerala 1981 = 82 PQLI despite low GDP — proved social development possible.
- <b>WB Income Classification (2024 thresholds):</b> High >$13,845 · Upper-middle $4,466-13,845 · Lower-middle $1,136-4,465 · Low <$1,135. SL = lower-middle (~$3,800).
- <b>MDGs 2000-2015 (8 goals):</b> 1.Poverty 2.Education 3.Gender 4.Child mortality 5.Maternal health 6.HIV/malaria 7.Environment 8.Partnership. Halved extreme poverty.
- <b>SDGs 17 goals (memorize key ones):</b> 1=Poverty · 2=Hunger · 3=Health · 4=Education · 5=Gender · 6=Water · 7=Energy · 11=Cities · 13=Climate · 14=Marine · 15=Land · 16=Justice · 17=Partnerships.
- <b>Sen Capability Approach:</b> Development = expanding people's freedoms to choose lives they value. Functionings (what we do) + Capabilities (what we can do). Famine = entitlement failure, not just food shortage.
- <b>Economic indicators detail:</b> GDP (domestic output); GNI = GDP + foreign income; PPP-adjusted = comparable across countries; growth rate annual %; per capita = GDP/pop; Gini = inequality (0-1).
- <b>Social indicators detail:</b> Life expectancy (Japan 84 → Sierra Leone 55); IMR/1000 (Finland 2 → Sierra Leone 80); Literacy (Norway 100% → Niger 35%); GDI/GII = gender; MMR = maternal mortality; tertiary enrolment.
- <b>Env indicators detail:</b> CO₂/capita (Qatar 37→USA 14→India 1.9→Burundi 0.2); Forest % (Bhutan 71→SL 29→Bangladesh 11); EPI Yale+Columbia annual; Ecological Footprint Global Footprint Network; renewable energy %.
- <b>Composite indices:</b> HDI (UNDP 1990); PQLI (Morris 1979); IHDI (inequality-adjusted HDI); MPI (Multidimensional Poverty Index — UN); HPI (Happy Planet Index); Bhutan GNH (Gross National Happiness).
- <b>Country sustainability leaders:</b> Costa Rica 99% renewable. Bhutan carbon-negative + GNH framework. Denmark wind 50%+. Norway EVs 80%+. Iceland 85% renewable + geothermal heating. Sweden net-zero law. Rwanda plastic bag ban + ICT leapfrog. Singapore Green Plan 2030.
- <b>Intermediate categories:</b> NICs/Asian Tigers (S.Korea/Taiwan/Singapore/HK); BRICS+ (Brazil/Russia/India/China/SA/UAE/Iran/Egypt/Ethiopia); Tiger Cubs (Malaysia/Thailand/Philippines/Indonesia); LDCs 46 countries; Petro-states; Conflict states.
பரீட்சைக்கு முந்தின இரவு முழு அலகையும் ஓட்டிப் பார்.
- <b>Memorize:</b> HDI=UNDP 1990. PQLI=Morris 1979. Brundtland 1987. MDGs 2000-2015 (8). SDGs 2015-2030 (17). SDG 13=Climate. Asian Tigers=4 NICs. LDC count=46.
- <b>SL position:</b> GDP/capita ~$3,800 (lower-middle); HDI 0.78 High (#78); life exp 77; literacy 93%; IMR 6; population 22M; demographic stage 3-4.
- <b>எளிதில் தவறும்:</b> (1) HDI 3 dimensions ≠ PQLI 3 indicators (different). (2) GNI = GDP + foreign income. (3) Sustainable = 3 pillars (not env only). (4) MDGs preceded SDGs (replaced, not in addition). (5) Sen capabilities approach.
- <b>Country examples to memorize:</b> Switzerland HDI #1; Bhutan carbon-negative; Costa Rica renewable; Norway EV leader; S.Korea NIC; Bangladesh graduating LDC 2026.
- <b>கட்டுரைக்குத் தயார்:</b> (1) Old vs new development concept + 3 indicator types. (2) Sustainable development + 3 pillars + SDGs. (3) Developed vs developing + intermediate categories + WB income tiers.
- <b>Modern shift:</b> binary developed/developing dropped by WB since 2016 — uses income tiers + multi-dim indicators. Spectrum continuous not categorical.
- <b>Challenges to SDGs 2030:</b> COVID setback, Ukraine war, climate crisis, financing $2.5-3T/yr gap, inequality rising, geopolitical fragmentation. UN says most goals off-track.
- <b>Emerging concepts:</b> Green economy, Circular economy, ESG investing, Just transition, Doughnut economics (Kate Raworth), Net-zero 2050.