இலங்கையின் சனத்தொகை
கடந்த அலகில் உலக சனத்தொகையை, அதாவது அதன் வளர்ச்சி, பரம்பல், அமைப்பு ஆகியவற்றை, பார்த்தோம். இப்போது அந்த உலக சனத்தொகையின் ஒரு சிறிய, ஆனால் மிகவும் வேறுபட்ட பகுதியான இலங்கையின் சனத்தொகையை நெருக்கமாகக் கற்போம். ஏன் "மிகவும் வேறுபட்டது" என்று சொல்கிறேன்? ஏனெனில் வெறும் 65,610 கி.மீ² பரப்பளவுள்ள ஒரு சிறிய தீவு நாட்டில் பல இனங்கள், மதங்கள், மொழிகள், வாழ்க்கை முறைகள் ஒன்றாக வாழ்கின்றன. மேலும் சனத்தொகை தீவு முழுவதும் ஒரே சீராகப் பரம்பவில்லை; கொழும்பில் ஒரு சதுர கி.மீ-ல் 3,400-க்கு மேற்பட்டோர் வாழும்போது, முல்லைத்தீவில் வெறும் 92 பேர் தான். ஏன் இந்த வேறுபாடு? மக்கள் ஏன் ஒரிடத்தில் கூடுகிறார்கள், ஓரிடத்தைக் காலி செய்கிறார்கள்? இவ்வலகில் இலங்கையின் சனத்தொகை வளர்ச்சி, பரம்பல், அமைப்பு (இனம், மதம், வயது, பாலினம்), இடப்பெயர்வு ஆகியவற்றைக் கற்று, நமது நாட்டின் மக்களைப் புரிந்து கொள்வோம்.
1. சனத்தொகை — அடிப்படை எண்கள்
ஒரு குறிப்பிட்ட பகுதியில், ஒரு குறிப்பிட்ட காலத்தில் வாழும் மொத்த மக்கள் தொகையே சனத்தொகை (population). இலங்கையில் ஒவ்வொரு 10 ஆண்டுக்கும் ஒரு முறை சனத்தொகைக் கணக்கெடுப்பு (census) நடத்தப்படுகிறது; இதைச் செய்வது சனத்தொகை மதிப்பீட்டுப் புள்ளி விபரத் திணைக்களம் (Department of Census & Statistics).
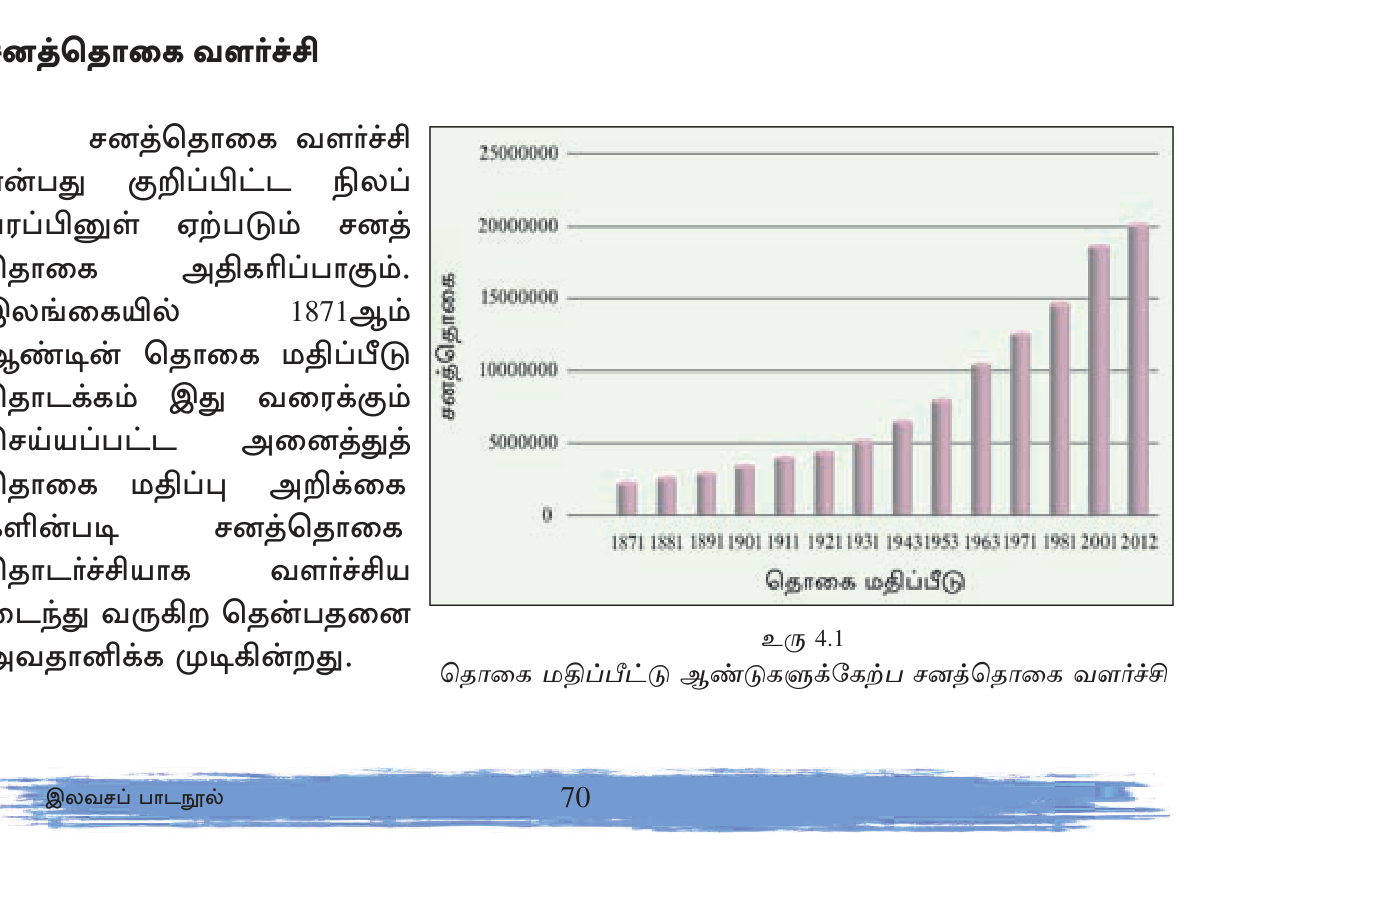
2012-ஆம் ஆண்டு கடைசியாக நடத்தப்பட்ட கணக்கெடுப்பின்படி இலங்கையின் மொத்த சனத்தொகை 20.3 மில்லியன் (சுமார் 2.03 கோடி). இலங்கையில் முதல் முறையாகச் சனத்தொகைக் கணக்கெடுப்பு நடத்தப்பட்டது 1871-ல்; அப்போது சனத்தொகை வெறும் 2,400,380. அதாவது 141 ஆண்டுகளில் நமது சனத்தொகை 8 மடங்குக்கு மேல் பெருகியுள்ளது!
2. சனத்தொகை வளர்ச்சி — இலங்கை எவ்வாறு பெருகியது?
வருடாந்த வளர்ச்சி வீதம் (annual growth rate) என்பது ஓர் ஆண்டில் சனத்தொகை எத்தனை சதவீதம் கூடியது என்பது. கணக்கீட்டுச் சூத்திரம் எளிது: பிறப்பு வீதத்திலிருந்து இறப்பு வீதத்தைக் கழித்து, குடிவரவைக் கூட்டி, குடியேற்றத்தைக் கழிக்க வேண்டும். இதனை வரலாற்றுடன் பார்த்தால் இலங்கையின் கதை மிகத் தெளிவாகிறது.
| தொகை மதிப்பீட்டு ஆண்டு | சனத்தொகை | வரு. வளர்ச்சி வீதம் (%) |
|---|---|---|
| 1871 | 2,400,380 | — |
| 1881 | 2,759,738 | 1.4 |
| 1891 | 3,007,789 | 0.9 |
| 1901 | 3,565,954 | 1.7 |
| 1911 | 4,106,350 | 1.4 |
| 1921 | 4,498,605 | 0.9 |
| 1931 | 5,306,871 | 1.7 |
| 1946 | 6,657,339 | 1.5 |
| 1953 | 8,098,096 | 2.8 (உச்சம்) |
| 1963 | 10,582,064 | 2.6 |
| 1971 | 12,689,895 | 2.2 |
| 1981 | 14,846,750 | 1.7 |
| 2001 | 18,797,257 | 1.2 |
| 2012 | 20,277,597 | 0.7 |
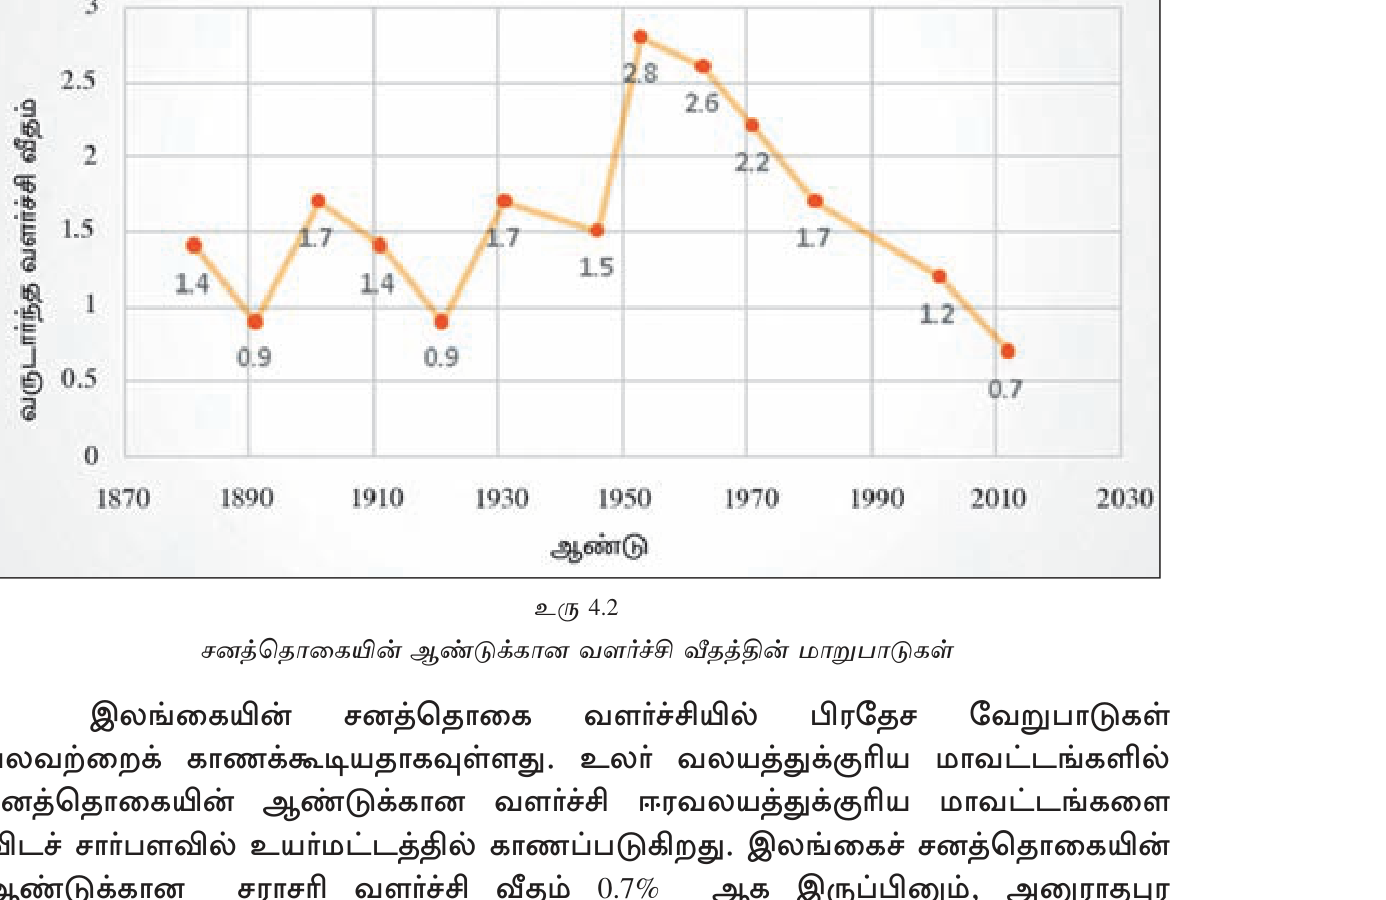
இந்த அட்டவணை ஒரு கதையைச் சொல்கிறது. 1871 முதல் 1946 வரை வளர்ச்சி வீதம் 1%–1.7% வரம்பில் அமைதியாக இருந்தது. ஆனால் 1946-க்கும் 1953-க்கும் இடையில் வளர்ச்சி வீதம் திடீரென 2.8%-க்கு உயர்ந்தது; இலங்கையின் சனத்தொகை வரலாற்றில் இதுவே உச்சம். ஏன்?
அதற்குக் காரணத்தை ஒற்றைச் சொல்லில் சொல்லலாம்: DDT. 1945-46-ல் இலங்கையில் மலேரியா ஒழிப்புத் திட்டம் ஆரம்பிக்கப்பட்டது; கொசுக்களைக் கொல்லும் DDT இரசாயனம் தீவெங்கும் தெளிக்கப்பட்டது. இதனால் இறப்பு வீதம் (குறிப்பாகச் சிசு இறப்பு) வேகமாகக் குறைந்தது; ஆனால் பிறப்பு வீதம் அதே உயர் மட்டத்தில் தொடர்ந்தது. பிறப்பு அதிகமாகவும் இறப்பு குறைவாகவும் இருந்ததால் வளர்ச்சி வீதம் உச்சத்தை அடைந்தது. இதை "சனத்தொகை வெடிப்பு (population explosion)" என்பர்.
1953-க்குப் பின்னர் வளர்ச்சி வீதம் தொடர்ந்து குறைந்து 2012-ல் வெறும் 0.7%-ஐ அடைந்தது. காரணம்? கல்வி வாய்ப்புகள் (குறிப்பாகப் பெண்களுக்கு) கூடின; குடும்பக் கட்டுப்பாட்டு முறைகள் பரவின; திருமண வயது தாமதமாகியது; தொழில் சார்ந்த நகர்வாழ்க்கை வந்தது. இதனால் பிறப்பு வீதம் குறைந்தது.
3. சனத்தொகைப் பரம்பல் — ஏன் ஓரிடத்தில் கூட்டம், ஓரிடத்தில் காலி?
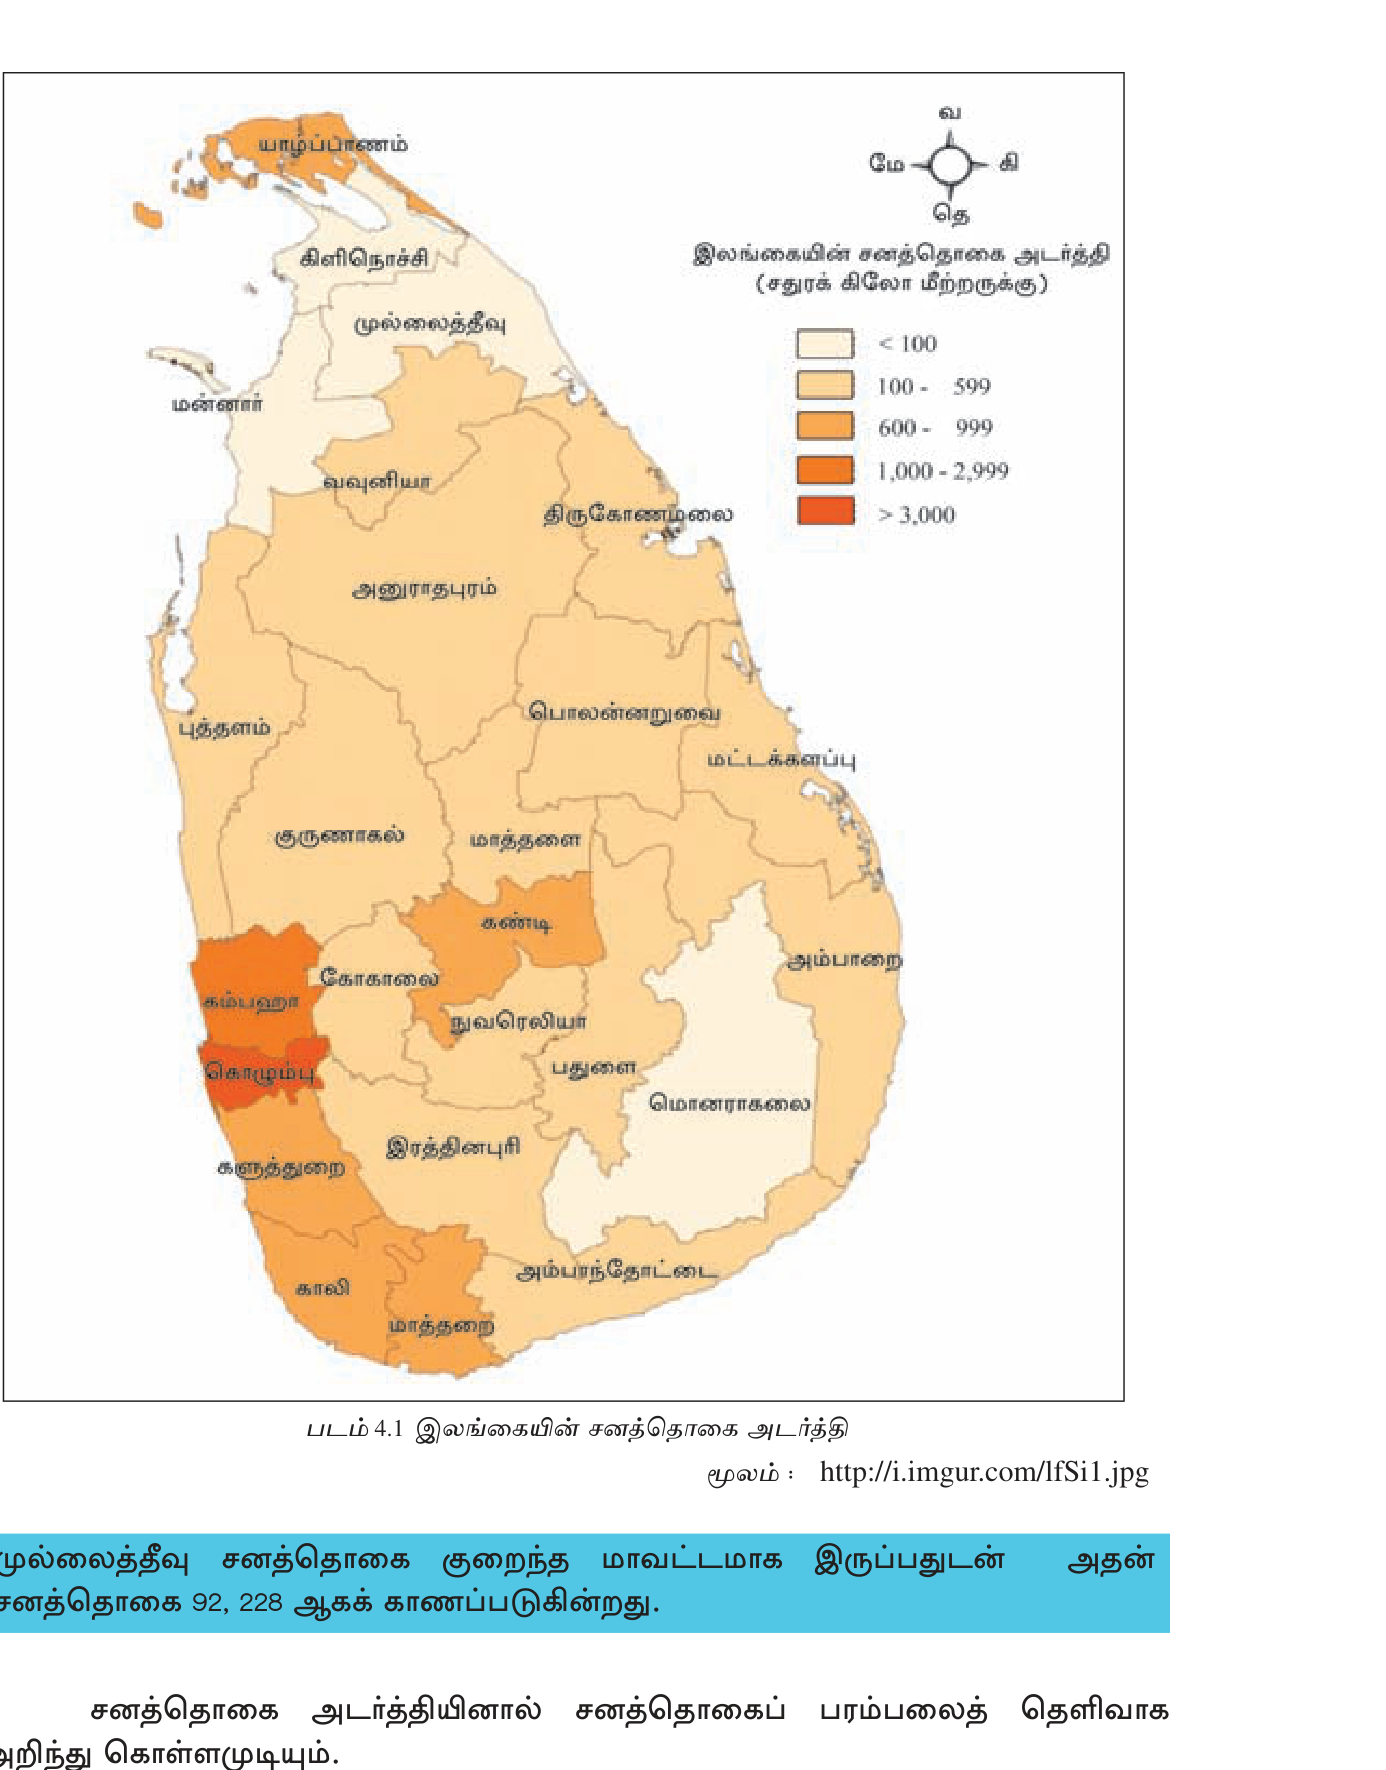
இலங்கை சனத்தொகை தீவெங்கும் ஒரே சீராகப் பரம்பவில்லை. சில மாவட்டங்களில் மக்கள் கூட்டமாக நெருங்கிக் கிடக்கிறார்கள்; சிலவற்றில் மிகக் குறைவு. இந்த வேறுபாட்டை அளக்க உதவுவதே சனத்தொகை அடர்த்தி (population density); அது ஒரு சதுர கி.மீ-ல் வாழும் மக்களின் எண்ணிக்கையாகும்.
2012-ல் இலங்கையின் சராசரி சனத்தொகை அடர்த்தி 323 பேர்/கி.மீ² ஆகும். ஆனால் இது சராசரி மட்டுமே; உண்மையில் மாவட்ட மட்டத்தில் வேறுபாடு பெரியது.
| நிலை | மாவட்டம் | அடர்த்தி (பேர்/கி.மீ²) |
|---|---|---|
| மிக அதிக அடர்த்தி | கொழும்பு | 3,438 |
| அதிக | கம்பஹா, களுத்துறை, யாழ்ப்பாணம், மாத்தறை | 1,000–2,999 |
| நடுத்தர | கண்டி, இரத்தினபுரி, குருநாகல் | 300–999 |
| குறைந்த | அநுராதபுரம், பொலன்னறுவை, மொனராகலை, அம்பாறை | 100–299 |
| மிகக் குறைந்த | மன்னார் (228), முல்லைத்தீவு (92) | < 100 |
ஏன் கொழும்பில் ஒரு சதுர கி.மீ-ல் 3,438 பேர், ஆனால் முல்லைத்தீவில் வெறும் 92 பேர்? இதற்கான காரணங்கள் ஐந்து வகைப்படும்:
- நிலத் தோற்றம்: தட்டையான தீரப் பகுதி (கொழும்பு, கம்பஹா) வசிப்பதற்கு எளிது; செங்குத்தான மலைப் பகுதி (மத்திய மலைநாடு) வசிப்பதற்குக் கடினம்.
- காலநிலையும் நீர் வசதியும்: மாகாலாய மழை பெறும் ஈர வலயம் (தென்மேற்கு) விவசாயத்திற்கு ஏற்றது; உலர் வலயம் (வடக்கு, கிழக்கு, தென்கிழக்கு) நீர்ப் பாசனத்தைப் பொறுத்தது.
- பொருளாதாரமும் வேலை வாய்ப்பும்: கொழும்பில் அரசாங்கம், துறைமுகம், வங்கி, தொழிற்சாலை ஆகியவை உள்ளன. வேலை இருக்கும் இடமே மக்கள் கூடும் இடமாகும்.
- போக்குவரத்தும் உட்கட்டமைப்பும்: சாலை, புகையிரதம், மின்சாரம் கிடைக்கும் இடம் கூட்டத்தை ஈர்க்கிறது.
- வரலாற்றுக் காரணியும் உள்நாட்டுப் போரும்: 30 ஆண்டு போர் (1983–2009) வடக்கு–கிழக்கு மாவட்டங்களின் சனத்தொகையைப் பெரிதும் பாதித்தது; இடம்பெயர்வும் இறப்பும் இதற்குக் காரணம்.
4. நகர்ப்புற–கிராமப்புற–தோட்டப்புற பகுப்பு
வாழ்க்கை முறையின் அடிப்படையில் இலங்கைச் சனத்தொகை மூன்று துறைகளாக (sectors) பிரிக்கப்படுகிறது.
| துறை | 2012 சதவீதம் | பண்பு |
|---|---|---|
| கிராமப்புறம் (rural) | 77.3% | பெரும்பான்மை. விவசாயம், மீன்பிடி, கைத்தொழில் — பாரம்பரிய வாழ்க்கை. |
| நகர்ப்புறம் (urban) | 18.2% | நகர சபை + மாநகர சபை பகுதிகள். கொழும்பு, கம்பஹா, கண்டி. |
| தோட்டப்புறம் (estate) | 4.4% | தேயிலை, ரப்பர் தோட்டங்களில் வாழும் மக்கள் — பெரும்பாலும் இந்தியத் தமிழர். |
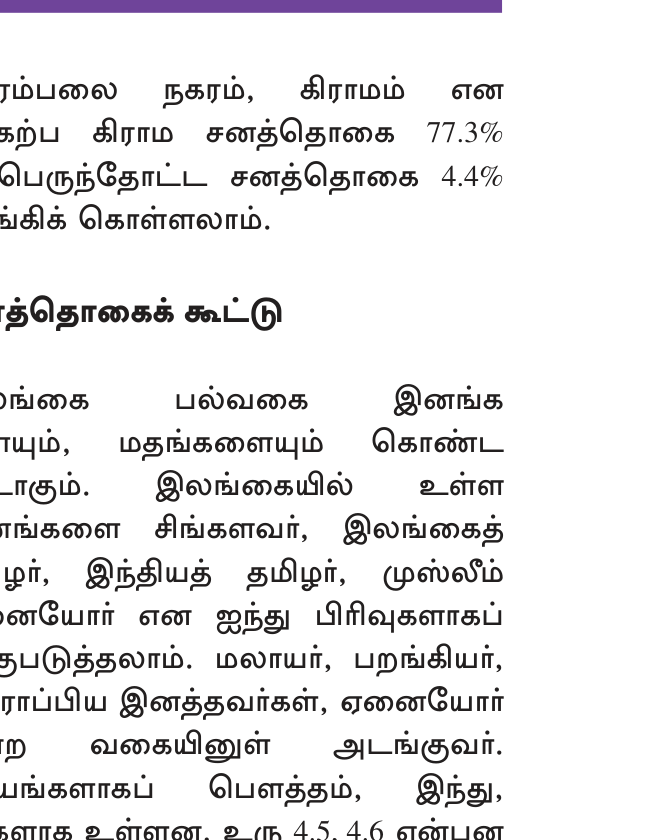
உலகச் சராசரியோடு (~55% நகர்ப்புறம்) ஒப்பிடும்போது இலங்கையில் நகர்ப்புற சனத்தொகை மிகக் குறைவு. இது ஓர் அபிவிருத்தி அடையாளம்; பெரும்பாலான மக்கள் இன்னும் கிராமப் பொருளாதாரத்தைச் சார்ந்திருப்பதைக் காட்டுகிறது. ஆனால் நகர்ப்புறச் சனத்தொகை படிப்படியாகக் கூடி வருகிறது; வேலை தேடி நகருக்கு இடம்பெயர்வதே (rural-to-urban migration) இதற்குக் காரணம்.
5. சனத்தொகை அமைப்பு — இனம், மதம்
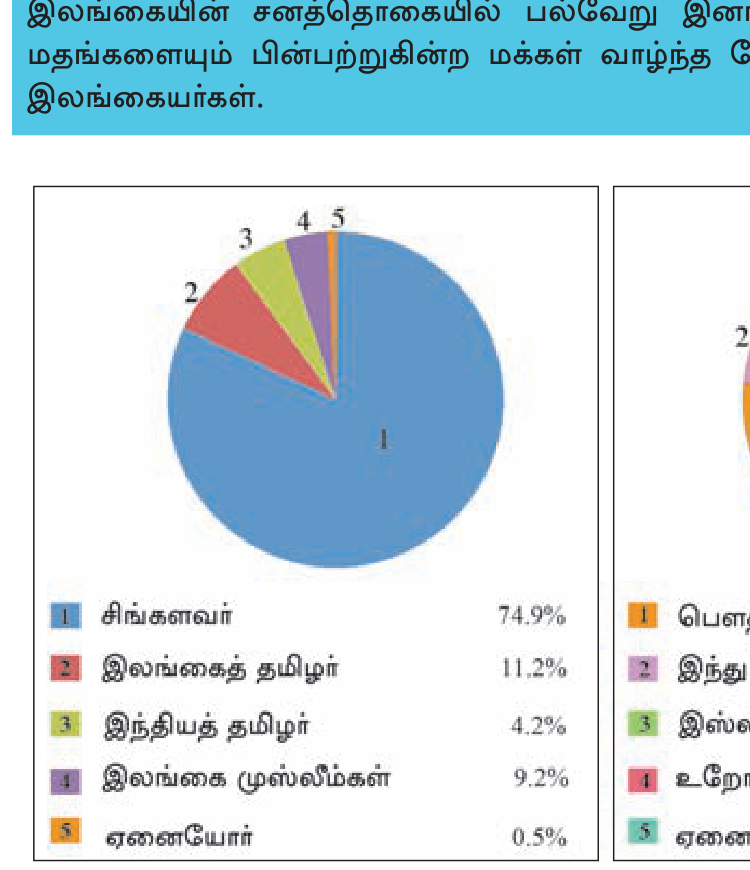
இலங்கை சனத்தொகையின் தனிச் சிறப்பே அதன் பல்லினப் பல்மதப் பண்பு. இது தற்செயல் அல்ல; ஆயிரக்கணக்கான ஆண்டுகளாக வெவ்வேறு காலகட்டங்களில் வந்து குடியேறிய மக்களின் கலவையே இது. சிங்களவர், இலங்கைத் தமிழர், இந்தியத் தமிழர், முஸ்லீம், பறங்கியர், மலாயர், வேடர் ஆகிய ஒவ்வோர் இனத்துக்கும் வேறுபட்ட மொழி, கலாசாரம், மதம், வரலாறு உள்ளன.
இனப் பகுப்பு (2012)
| இனம் | % |
|---|---|
| சிங்களவர் | 74.9 |
| இலங்கைத் தமிழர் | 11.2 |
| இலங்கை முஸ்லீம் | 9.2 |
| இந்தியத் தமிழர் | 4.2 |
| ஏனையோர் (பறங்கியர், மலாயர், வேடர்) | 0.5 |
மதப் பகுப்பு (2012)
| மதம் | % |
|---|---|
| பௌத்தம் | 70.2 |
| இந்து மதம் | 12.6 |
| இஸ்லாம் | 9.7 |
| கிறிஸ்தவம் (ரோமன் கத்தோலிக்கம் + ஏனையோர்) | 7.4 |
| ஏனைய மதங்கள் | 0.05 |
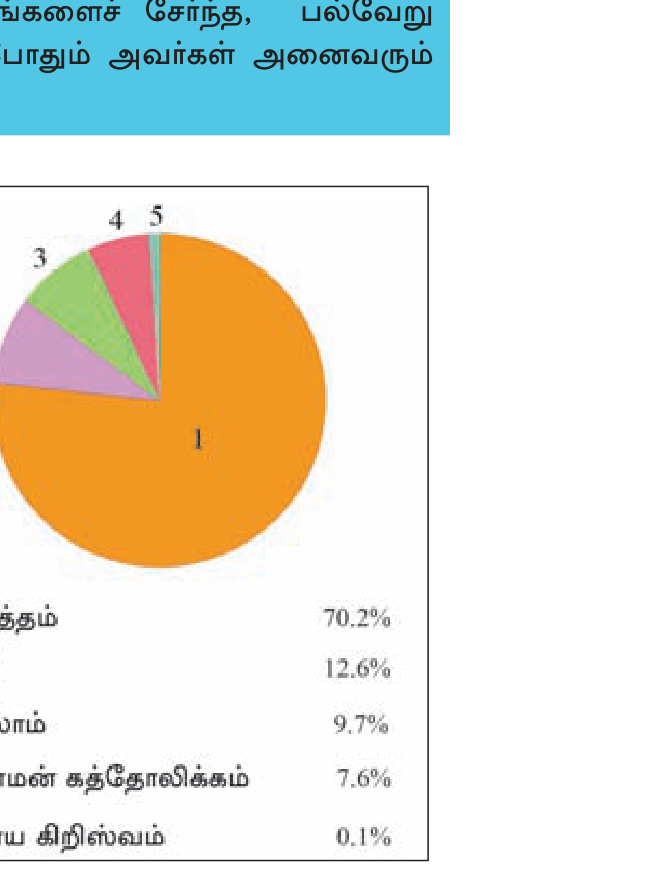
இனப் பகுப்பும் மதப் பகுப்பும் ஒன்றுக்கொன்று முற்றிலும் ஒத்துப்போகாது. சிங்களவரில் பெரும்பான்மையினர் பௌத்தர்கள்; ஆனால் ஒரு பகுதி சிங்கள மக்கள் கிறிஸ்தவர்கள் (கத்தோலிக்கர்கள்). இலங்கைத் தமிழரில் பெரும்பான்மையினர் இந்துக்கள்; ஆனால் ஒரு பகுதியினர் கிறிஸ்தவர்கள். முஸ்லீம்கள் இன ரீதியாக ஒரு தனி இனம் ("இலங்கை முஸ்லீம்"); அவர்களின் மொழி தமிழ், மதம் இஸ்லாம். இந்த நுட்பத்தைக் கட்டுரையில் தெளிவாகக் காட்டினால் நிறைய புள்ளி கிடைக்கும்.
6. வயது–பாலின அமைப்பு
ஒரு நாட்டின் சனத்தொகையைப் பணியாற்றும் வயதினர் (15–59), தங்கியிருப்போர் (கீழ் 15, 60-க்கு மேல்) என இரு பெரும் பிரிவாகப் பிரிக்கலாம். தங்கியிருப்போர் என்பவர்கள் வேலை செய்யாமல், பணியாற்றும் வயதினரின் வருமானத்தைச் சார்ந்திருப்போர் (குழந்தைகளும் முதியோரும்).
| வயது வகுப்பு | 2012 சதவீதம் |
|---|---|
| 0 – 14 (குழந்தைகள், தங்கியிருப்போர்) | 25.6% |
| 15 – 59 (பணியாற்றும் வயதினர்) | 62.2% |
| 60 + (முதியோர், தங்கியிருப்போர்) | 12.2% |
இலங்கை இப்போது ஒரு சுவாரசியமான நிலையில் உள்ளது. வளர்ச்சி வீதம் குறைந்ததால் குழந்தைகள் சதவீதம் குறைகிறது; ஆயுள் எதிர்பார்ப்பு கூடியதால் முதியோர் சதவீதம் கூடுகிறது (12.2%, கூடிக் கொண்டிருக்கிறது). இதை "சனத்தொகை வயோதிபமாதல் (population ageing)" என்பர். ஜப்பான், இத்தாலி போன்ற நாடுகளில் ஏற்கனவே நடந்துகொண்டிருக்கும் இந்த நிகழ்வே இலங்கையிலும் தொடங்கியுள்ளது. இதன் விளைவாக எதிர்காலத்தில் ஓய்வூதியம், சுகாதார சேவை, முதியோர் பராமரிப்புத் தேவை அதிகரிக்கும்.
பாலினப் பகுப்பு
2012-ல் இலங்கைச் சனத்தொகையில் ஆண்கள் 48.5%, பெண்கள் 51.5%. பாலின விகிதம் (sex ratio) என்பது 1000 பெண்களுக்கு எத்தனை ஆண்கள் என்பதாகும்; அது சுமார் 941. அதாவது பெண்கள் சற்றுக் கூடுதல். இதற்குக் காரணங்கள்: ஆண்களின் ஆயுள் எதிர்பார்ப்பு சற்றுக் குறைவு; கட்டடம், போக்குவரத்து போன்ற ஆபத்தான தொழில்களில் ஆண்கள் கூடுதல்; வெளிநாட்டு வேலை வாய்ப்புகளில் ஆண்கள் அதிகம்.
7. இடப்பெயர்வு (Migration) — ஒரு பகுதியை விட்டு இன்னொரு பகுதிக்கு
நிரந்தரமாகவோ அரை நிரந்தரமாகவோ ஒருவர் ஒரு இடத்திலிருந்து வேறொரு இடத்துக்கு வாழ்க்கையை மாற்றுவதே இடப்பெயர்வு (migration). இது இரு பெரும் வகைப்படும்: உள்நாட்டு (இலங்கையினுள்) இடப்பெயர்வு, சர்வதேச (இலங்கைக்குள் அல்லது வெளியே) இடப்பெயர்வு.
உள்நாட்டு இடப்பெயர்வு
- கிராமத்திலிருந்து நகரத்துக்கு: வேலை, கல்வி, மருத்துவ சேவை தேடி மக்கள் செல்கின்றனர்; இதுவே பெரும்பான்மை வடிவம்.
- கிராமத்திலிருந்து கிராமத்துக்கு: அரசாங்கக் குடியேற்றத் திட்டங்களின் கீழ் நடைபெறுகிறது. எ.கா. மகாவலி பாசனத் திட்டத்தின் கீழ் தென் மத்திய, ஈர வலயங்களிலிருந்து உலர் வலயத்துக்கு (பொலன்னறுவை, அநுராதபுரம்) மக்கள் குடியேற்றப்பட்டனர்.
- போரினால் ஏற்பட்ட இடப்பெயர்வு: 1983–2009 உள்நாட்டுப் போரின் காலத்தில் வடக்கு–கிழக்கிலிருந்து பல லட்சம் பேர் கொழும்புக்கும் வெளிநாடுகளுக்கும் இடம்பெயர்ந்தனர்.
சர்வதேச இடப்பெயர்வு
- வெளியேறும் இடப்பெயர்வு: மத்திய கிழக்கு (சவூதி, ஐ.அ.எ., குவைத்) நாடுகளுக்கு வீட்டுப் பணி, கட்டடப் பணி ஆகியவற்றுக்காகவும், ஐரோப்பா, கனடா, ஆஸ்திரேலியா, அமெரிக்கா நாடுகளுக்கு உயர் கல்வி, நிபுணத்துவ வேலை ஆகியவற்றுக்காகவும் மக்கள் செல்கின்றனர். தொழிலாளர் பணம் (remittances) இலங்கையின் மிக முக்கியமான வெளிநாட்டு வருமான ஆதாரங்களில் ஒன்றாக மாறியது.
- உள்வரும் இடப்பெயர்வு: மிகக் குறைவு; சில சர்வதேச நிறுவன ஊழியர்களும் சிறு வர்த்தகர்களுமே வருகின்றனர்.
8. இலங்கைச் சனத்தொகை — பிரச்சினைகளும் தீர்வுகளும்
இன்று இலங்கையின் சனத்தொகை வேகமாக வளர்ந்து கொண்டிருக்கவில்லை; ஆனால் சனத்தொகை சார்ந்த புதிய பிரச்சினைகள் தோன்றியுள்ளன.
- சனத்தொகை வயோதிபமாதல்: முதியோர் சதவீதம் கூடி வருகிறது; ஓய்வூதியம், வயோதிப மருத்துவம், முதியோர் இல்லங்கள் ஆகியவை எதிர்காலத்தில் அதிகம் தேவைப்படும்.
- நகர் சார்ந்த நெருக்கம்: கொழும்பு, கம்பஹா ஆகியவற்றில் அடர்த்தி மிக அதிகம்; அதனால் குடியிருப்பு நெருக்கடி, போக்குவரத்து நெரிசல், சுற்றுச்சூழல் மாசு ஏற்படுகின்றன.
- மாகாண சமச்சீரின்மை: கொழும்பில் வேலை வாய்ப்புகள் உள்ளன; வடக்கில் கிராமங்கள் காலியாகின்றன.
- வெளிநாட்டு வேலைக்குச் சென்ற பெண்களின் குடும்பப் பாதிப்பு: குழந்தைகளின் பராமரிப்பு, கல்வி, மனநிலை ஆகியவற்றில் தாக்கம் ஏற்படுகிறது.
தீர்வுகள்: கிராமப்புற வேலை வாய்ப்புகளை உருவாக்குதல் (இது கொழும்பின் சுமையைக் குறைக்கும்), மாகாண அபிவிருத்தி (வடக்கு–கிழக்கின் மீள் கட்டுமானம்), முதியோர் பராமரிப்புத் திட்டங்கள், கல்விப் பல்வகைப்படுத்தல், சர்வதேச வேலை வாய்ப்புகளில் வாழ்க்கை நிலையை மேம்படுத்தல் ஆகியவை தீர்வுகளாகும்.
- 2012 சனத்தொகை = 20.3 மில்லியன்; சராசரி அடர்த்தி = 323/கி.மீ²; முதல் கணக்கெடுப்பு = 1871 (2.4 மி.).
- வளர்ச்சி உச்சம் = 1953-ல் 2.8% (மலேரியா ஒழிப்பு, DDT); 2012 = 0.7% (பெண் கல்வி, குடும்பக் கட்டுப்பாடு).
- மிக அதிக அடர்த்தி = கொழும்பு 3,438; மிகக் குறைந்தது = முல்லைத்தீவு 92, மன்னார் 228. மிக அதிக சனத்தொகை = கொழும்பு (2,323,826).
- துறை: கிராமம் 77.3% · நகரம் 18.2% · தோட்டம் 4.4%.
- இனம்: சிங்கள 74.9 · இலங்கைத் தமிழ் 11.2 · இலங்கை முஸ்லீம் 9.2 · இந்தியத் தமிழ் 4.2 · ஏனை 0.5.
- மதம்: பௌத்தம் 70.2 · இந்து 12.6 · இஸ்லாம் 9.7 · கிறிஸ்தவம் 7.4.
- வயது: 0–14 = 25.6% · 15–59 = 62.2% · 60+ = 12.2%. பெண் 51.5%, ஆண் 48.5%.
- இடப்பெயர்வு: கிராமத்திலிருந்து நகரத்துக்கு (உள்நாடு); சவூதி, ஐ.அ.எ., குவைத் (சர்வதேசம்); மகாவலித் திட்டம் என்பது அரசு ஏற்படுத்திய கிராமத்திலிருந்து கிராமத்துக்கான இடப்பெயர்வு.
- இலங்கைத் தமிழரும் இந்தியத் தமிழரும் வேறு வேறானவர்கள். இலங்கைத் தமிழர் வடக்கு–கிழக்கில் ஆயிரக்கணக்கான ஆண்டுகளாக வாழ்பவர்கள்; இந்தியத் தமிழர் 19-ம் நூற்றாண்டில் தோட்டத்துக்கு வந்தவர்கள், மலைநாட்டில் வாழ்கின்றனர்.
- "இலங்கை முஸ்லீம்" ஒரு தனி இனம். அவர்களின் மொழி தமிழ், மதம் இஸ்லாம்; ஆனால் இனரீதியாகத் தமிழர் அல்ல எனக் கணக்கெடுப்பு கருதுகிறது.
- 1953 வளர்ச்சி உச்சத்துக்குக் காரணம் இறப்பு வீதம் குறைந்தது (மலேரியா ஒழிப்பு); பிறப்பு வீதம் கூடியதல்ல.
- "சனத்தொகை வெடிப்பு" = உச்ச வளர்ச்சி வீதம்; ஆனால் இலங்கையில் இப்போது வளர்ச்சி குறைந்து வயோதிபமாதல் பிரச்சினையாக மாறிக் கொண்டிருக்கிறது.
- சனத்தொகை அடர்த்தி = பேர் ÷ பரப்பு. "மிக அதிக சனத்தொகை மாவட்டம்" என்பதும் "மிக அதிக அடர்த்தி மாவட்டம்" என்பதும் ஒன்றல்ல; இரண்டும் கொழும்பாக இருந்தாலும் வேறுபடுத்தித் தெரிய வேண்டும்.
- "நகர்ப்புறம்" என்பது நகர சபை அல்லது மாநகர சபை எல்லைக்குள் உள்ள பகுதியாகும்; வாழும் முறையின் அடிப்படையில் வரையறுக்கப்படுவதில்லை.
- பௌத்த மதம் 70.2%; இதைச் சிங்களவர் சதவீதத்துடன் (74.9%) குழப்பிக்கொள்ளாதே; சில சிங்களவர் கிறிஸ்தவர்கள்.
✅ விரைவுச் சோதனை
முக்கியக் கருத்துக்களை உறுதிப்படுத்துங்கள். தவறான விடைகள் உங்கள் தவறுக் குறிப்பேட்டில் சேமிக்கப்படும்.
🖊 கட்டுரை வினாக்கள் (பகுதி II)
பரீட்சை வடிவில் கட்டமைப்பு வினாக்கள். முதலில் நீங்களே எழுதுங்கள்; பின்னர் மாதிரி விடையைத் திறந்து சரிபாருங்கள்.
விடைத் திட்டம் — சேர்க்க வேண்டிய புள்ளிகள்:
- 1871 first census 2.4M
- 1948 ind 7.5M
- 1953 NI peak 2.8% (malaria eradication DDT)
- 2012 = 20.3M; growth 0.7%
- Causes of peak: death rate fell, birth stayed high
- Causes of decline: female ed, urbanization, contraception, late marriage
- Current concerns: aging
- TFR ~2.0 replacement
**1871 First Census:** British colonial administration conducted SL's first systematic census = 2.4 million. Subsequent censuses every 10 years (1881, 1891... with WWII gaps).
**Growth Trajectory:**
- 1871: 2.4M
- 1901: 3.6M
- 1921: 4.5M
- 1946: 6.7M
- 1953: 8.1M
- 1971: 12.7M
- 1981: 14.8M
- 2001: 18.7M
- 2012: 20.3M
- 2024 (estimated): ~22M
**1953 Growth Peak (NI = 2.8%):**
This was SL's highest natural increase rate. Causes:
1. **Malaria eradication 1947-49** — Pioneer DDT spraying (under WHO + Rockefeller Foundation) wiped out malaria from dry zone. Death rate from malaria + other infectious diseases dropped sharply.
2. **Antibiotics + vaccinations** — penicillin, smallpox, polio campaigns.
3. **Maternal + child health services** — birth attendants, maternity wards.
4. **Birth rates remained high** — traditional large family preference, religious + cultural factors.
5. **Net immigration** — Indian Tamil estate labour expansion (gradually).
Result: deaths fell from 22/1000 to ~10/1000 in a decade; births stayed at ~37/1000 → NI ~2.8%/year = population doubling in 25 years.
**Decline Phase (1953 → 2012, NI 2.8% → 0.7%):**
1. **Female education** — SL has highest female literacy in South Asia (~93%). Educated women marry later, have fewer children.
2. **Family planning programmes** — Family Health Bureau (1965), Sri Lanka Family Planning Association (1953). Voluntary contraception access (free pills, IUDs, sterilization).
3. **Late marriage** — Average female marriage age 18 (1950s) → 25+ (2020).
4. **Urbanization** — even at 18%, cities reduce family size.
5. **Improved child survival** — fewer children needed for old-age security.
6. **Economic factors** — costs of education + housing in cash economy.
7. **War + emigration** — 1983-2009 civil war caused 100,000+ casualties + huge emigration (especially Tamils to Canada, UK, Australia, Europe; Sinhalese to Middle East labour).
8. **TFR decline** — total fertility rate 5.5 (1953) → 2.0 (2012). At/below replacement (2.1).
**Current Concerns (Post-2012):**
- Aging population — 60+ rose from 12.2% (2012) to ~16% (2024); projected 25% by 2040.
- Pension system stress (EPF, ETF, government pensions).
- Healthcare demand for chronic diseases (CKD, diabetes, hypertension, cancer).
- Workforce shrinkage — manpower shortages in agriculture, construction.
- Migration drain — youth emigration to Australia, Canada, EU after 2022 economic crisis.
- Brain drain concerns — doctors, engineers, IT workers leaving.
**Comparison with neighbours:** SL ahead of South Asian average (Pakistan, Bangladesh, India still in Stage 3). Closer to East Asian transition (Thailand, Vietnam). Behind Japan/Korea Stage 5 (already declining).
Projection: SL population may peak around 22-23M by 2030-2035 then plateau or decline.
விடைத் திட்டம் — சேர்க்க வேண்டிய புள்ளிகள்:
- Total 20.3M; density 323/km²
- Provincial: Western 30% concentration
- District: Colombo highest (2.3M + 3438/km²)
- Sector: Rural 77.3% + Urban 18.2% + Estate 4.4%
- Ethnic: Sinhala 74.9 + SL Tamil 11.2 + SL Moor 9.2 + Indian Tamil 4.2
- Religion: Buddhist 70.2 + Hindu 12.6 + Islam 9.7 + Christian 7.4
- Age: 0-14=25.6, 15-59=62.2, 60+=12.2
- Gender: Female 51.5% Male 48.5%
- Mullaitivu lowest density
**மாகாண (Provincial) பகிர்வு:**
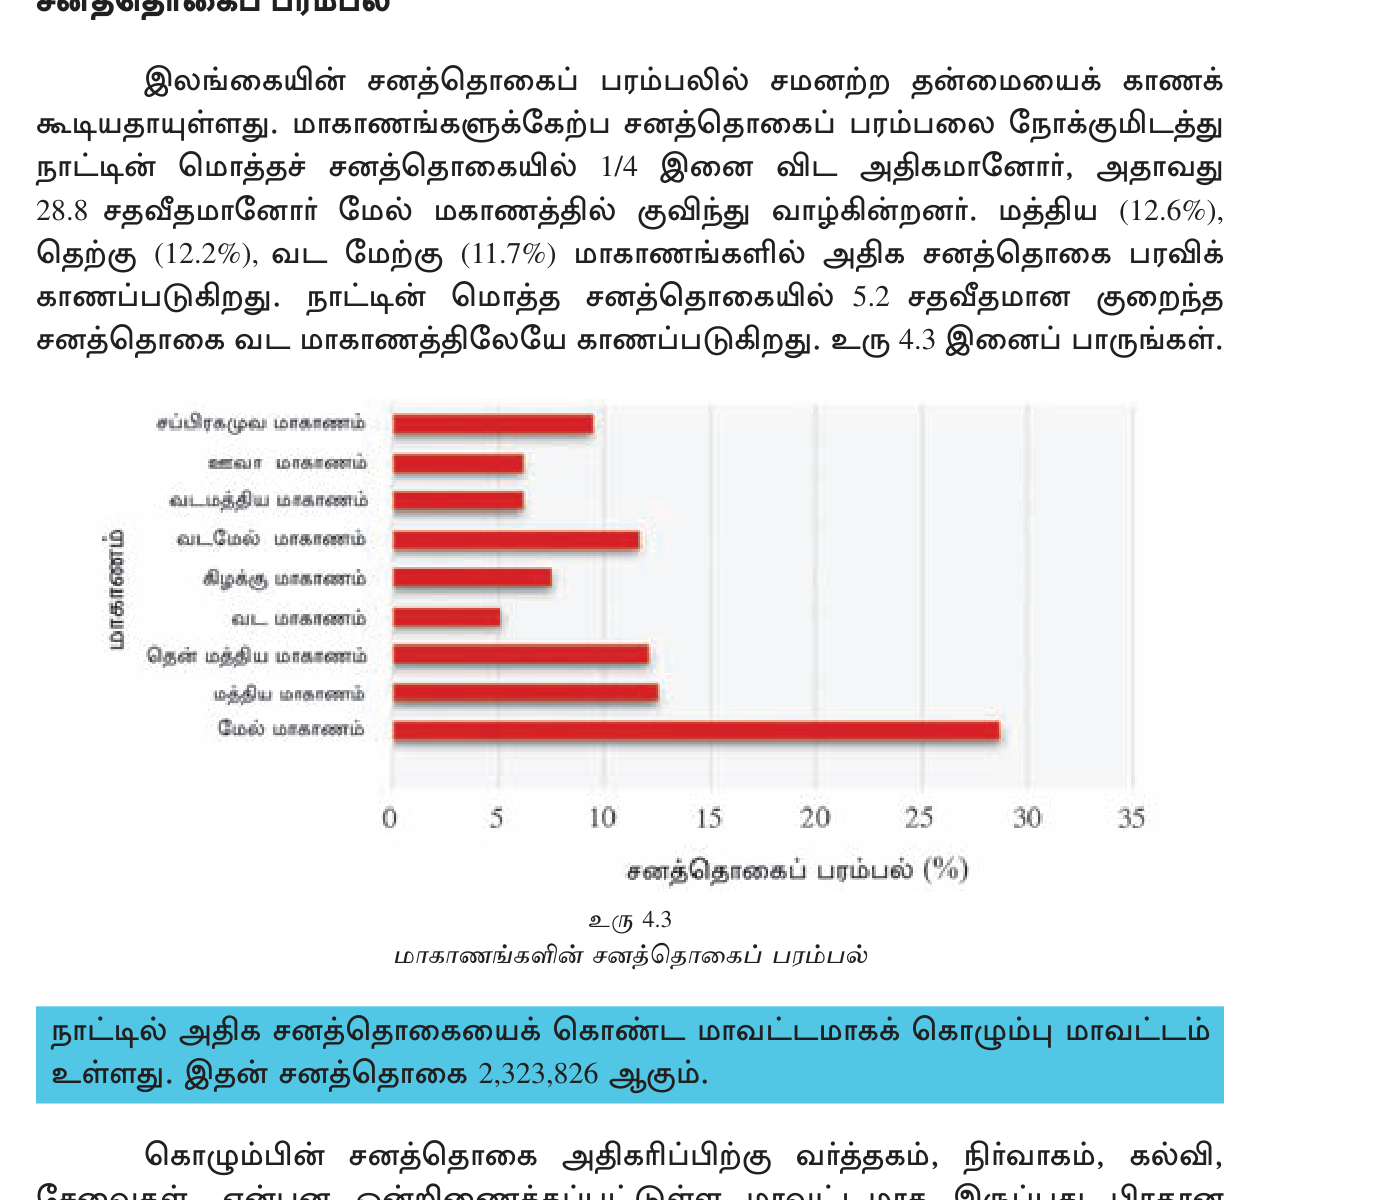
- Western (Colombo + Gampaha + Kalutara) = ~5.85M (29% — highest concentration despite smallest area)
- Central (Kandy + Matale + Nuwara Eliya) = 2.57M
- Southern (Galle + Matara + Hambantota) = 2.48M
- North Central (Anuradhapura + Polonnaruwa) = 1.27M
- Sabaragamuwa (Ratnapura + Kegalle) = 1.93M
- North Western (Kurunegala + Puttalam) = 2.38M
- Eastern (Trincomalee + Batticaloa + Ampara) = 1.55M
- Northern (Jaffna + Mannar + Kilinochchi + Mullaitivu + Vavuniya) = 1.06M (lowest — post-war recovery)
- Uva (Badulla + Monaragala) = 1.27M
**மாவட்ட (District) — Extremes:**
- **Highest population:** Colombo (2,323,826)
- **Highest density:** Colombo (3,438/km²)
- **Lowest density:** Mullaitivu (92/km²) — Northern Province post-war.
- Next-lowest: Mannar (228), Vavuniya (~240).
- Second-highest density: Gampaha (1,748/km²).
**Sector பகிர்வு (Settlement Type):**
- **கிராமம் (Rural) 77.3%** — most SL still rural. Lower than India (65%) but higher than Sri Lanka's South Asian neighbours.
- **நகர (Urban) 18.2%** — defined as Municipal Council / Urban Council areas. Tunctional urbanization higher (~33%).
- **தோட்டம் (Estate) 4.4%** — tea + rubber + coconut estate workers, primarily Indian Tamil community in Central Highlands. Declining as estates fragment.
**இனம் (Ethnic):**
- **சிங்களவர் (Sinhalese) 74.9%** — majority; Buddhist + some Christian. Mostly Southern + Western + Central + NCP + Sabaragamuwa.
- **இலங்கைத் தமிழர் (Sri Lanka Tamil) 11.2%** — ancient North + East communities; thousands of years presence. Mostly Hindu (some Christian + Muslim families).
- **இலங்கை முஸ்லீம் (Sri Lankan Moor) 9.2%** — Arab + local descent; Tamil-speaking but separate ethnicity (per Census). Mostly Eastern + scattered.
- **இந்தியத் தமிழர் (Indian Tamil) 4.2%** — 19th century British colonial plantation labour from South India; Central Highlands estates.
- **ஏனைய (Others) ~0.5%** — Burgher (Dutch + Portuguese descent), Malay, Veddha (indigenous), Chetty.
**மதம் (Religion):**
- **பௌத்தம் 70.2%** — Theravada Buddhism; mostly Sinhalese.
- **இந்து 12.6%** — mostly SL Tamil + Indian Tamil.
- **இஸ்லாம் 9.7%** — mostly Moor + Malay.
- **கிறிஸ்தவம் 7.4%** — Catholic (Sinhalese + Tamil) majority + Protestant minority.
Critical note: Sinhalese % (74.9) ≠ Buddhist % (70.2) because some Sinhalese are Christian.
**வயது (Age structure):**
- 0-14: 25.6% (declining)
- **15-59: 62.2%** — working age = demographic dividend.
- 60+: 12.2% (rising rapidly).
Median age ~31; rising. Dependency ratio currently favourable but worsening.
**பால் (Gender):**
- பெண் (Female) 51.5%
- ஆண் (Male) 48.5%
Slight female majority — partly due to civil war casualties (mostly male), partly because women live longer.
**முக்கிய அவதானிப்புகள்:**
1. **Western Province concentration** — Colombo + Gampaha + Kalutara = 30% of population on 6% of land. Economic + infrastructure pull.
2. **Northern recovery** — Post-2009 Northern Province population still recovering from war (Mullaitivu/Mannar lowest density).
3. **Estate decline** — tea estate workforce shrinking as plantations restructure + youth leave for cities.
4. **Ethnic concentration** — North + East predominantly Tamil + Muslim; South + Central predominantly Sinhalese. Border districts mixed.
5. **Religious demography** — strong correlation with ethnicity except Christianity (cross-cuts ethnic lines).
விடைத் திட்டம் — சேர்க்க வேண்டிய புள்ளிகள்:
- Internal: rural→urban (Colombo magnet)
- Mahaweli planned: wet→dry zone, ~1M moved
- War displacement 1983-2009: 800K+ Northern Tamils
- External: Middle East labour (1.5M+ Saudi/UAE/Kuwait)
- Tamil diaspora to Canada/UK/Europe (post-1983)
- Recent: 2022 crisis Australia/Canada migration
- Push: jobs, war, drought, poverty
- Pull: jobs, education, peace, family
**(அ) Internal Rural → Urban Migration:**
Classic developing country pattern. Rural villagers move to:
- **Colombo + Western Province** — largest pull magnet. Jobs (garments, services, government, construction).
- **Provincial capitals** — Kandy, Galle, Matara, Anuradhapura, Kurunegala.
- **Free Trade Zones** — Katunayake, Biyagama, Koggala (especially female garment workers from villages).
Causes: limited rural job opportunities, agricultural mechanization, education aspirations, better hospitals.
Effects: Colombo + Gampaha rapid urbanization; Northern + Eastern rural depopulation; "empty villages" phenomenon in some districts.
**(ஆ) Mahaweli Planned Resettlement (1977-onwards):**
Under Accelerated Mahaweli Programme, the largest planned demographic intervention in SL history:
- **~1+ million people** moved from wet zone (Kandy, Matale, Kegalle) + landless families → dry zone irrigated farms (Polonnaruwa, Anuradhapura, Ampara, Batticaloa).
- New towns built: Dehiattakandiya, Girandurukotte, Aralaganwila, Welikanda.
- Each settler family got ~1 ha paddy + 0.5 ha highland + house plot.
Controversies:
- Sinhalese-majority resettlement in Tamil-majority Eastern Province contributed to ethnic tensions.
- Original Vedda indigenous land overlap.
- Resettlement community trauma (cultural displacement).
**(இ) Civil War Displacement (1983-2009):**
Indo-Sri Lankan civil war caused massive forced displacement:
- ~800,000+ Northern + Eastern Tamils displaced internally (refugees in NCP, Vavuniya welfare centres, Colombo).
- ~150,000+ Muslims expelled from Northern Province by LTTE (1990 "ethnic cleansing" of Jaffna Muslims).
- ~75,000 deaths.
- Estate Tamils relocated due to violence (1983 Black July).
- Tamils fled to **Tamil diaspora** abroad — Canada (largest), UK, Australia, Germany, Norway, Switzerland, France. ~1 million Tamil diaspora globally.
Post-2009: gradual return + IDP resettlement; some still displaced after 15 years.
**(ஈ) Middle East Labour Migration:**
Since 1980s, large outflow of SL workers to Middle East:
- **~1.5 million SL workers** in Saudi Arabia, UAE, Kuwait, Qatar, Oman, Bahrain (peak ~2M in late 2010s).
- **Female housemaids ~60%** — domestic workers (controversial — abuse cases). Male construction, drivers, security guards.
- Bureau of Foreign Employment (SLBFE) regulates.
- **Remittances ~$5-7 billion/year** — largest foreign exchange source many years.
- Recent shifts: skilled labour (nurses, IT, engineers) to South Korea, Japan, Italy.
Family impact: "Middle East orphans" — children raised by grandparents while mother abroad; relationship strains; financial improvement.
**(உ) Recent: 2022 Economic Crisis + Brain Drain (2022-2024):**
2022 SL economic collapse + Aragalaya protests triggered massive emigration:
- 300,000+ left in 2022 alone (record).
- Destinations: Australia (skilled migration), Canada (Express Entry), UK, EU (Italy, Portugal), New Zealand.
- Doctors, IT workers, engineers, accountants — "brain drain."
- Estate Tamils + Sinhalese youth.
- Family unification + student visas + asylum claims.
**Push + Pull Framework:**
| Push Factors | Pull Factors |
|---|---|
| Unemployment / under-employment | Job opportunities |
| War / violence | Peace / security |
| Drought / crop failure | Better climate |
| Poverty | Higher wages |
| Lack of services (schools, hospitals) | Better services |
| Discrimination | Equal opportunity |
| 2022 economic crisis | Stable economies |
**Future Outlook:**
Continued urbanization + Western Province growth. Aging interior provinces. Diaspora children potentially returning (if SL stabilizes). EU + Australian + Canadian skilled migration likely continued. Estate sector demographic transformation.
விடைத் திட்டம் — சேர்க்க வேண்டிய புள்ளிகள்:
- Aging: 60+ 12.2% (2012) → 16% (2024) → 25% (2040)
- Pension/healthcare burden
- Urban Colombo congestion
- Regional imbalance: West vs North/East
- Female Middle East migration: children impact
- Solutions: rural employment, regional development, elderly care, education diversification, better foreign labour conditions
**(1) சனத்தொகை வயோதிபமாதல் (Aging Population):**
60+ population: 12.2% (2012) → ~16% (2024) → projected 25% by 2040 → ~30% by 2050. SL aging faster than peer countries (Bangladesh, Pakistan).
காரணம்: TFR 2.0 (replacement) + life expectancy 77 years (Asian + UN regional high).
சவால்கள்:
- **Pension burden** — Employees' Provident Fund (EPF), Employees' Trust Fund (ETF), Government Pension Scheme — actuarial deficits projected; current pay-as-you-go unsustainable.
- **Healthcare cost** — chronic diseases (diabetes, CKD, hypertension, cancer, dementia) replacing acute infectious — costlier, longer-duration care.
- **Workforce shrinkage** — agriculture + construction face labour shortages (already importing Indian + Nepalese workers).
- **Family structure** — fewer children, smaller families → less informal elderly care; traditional joint family declining.
- **Elder loneliness + abuse** — emerging issue; few institutionalized elder homes.
தீர்வுகள்:
- Strengthen EPF/ETF + pension reform (graduated retirement age, contribution rates).
- Universal health coverage expansion + chronic disease management.
- Elder care training, day-care centres, home-care services.
- Senior-friendly infrastructure (housing, transport).
- Promote ageing-in-place + community support.
- Skilled migration policy to import workers.
**(2) நகர் சார்ந்த நெருக்கடி (Urban Congestion):**
Colombo + Gampaha urban area — 30% population on 6% land. Issues:
- **Housing crisis** — informal settlements (~50% live in slums/underserved); land prices unaffordable; Megapolis plan poorly executed.
- **Traffic** — Colombo daily commute 2+ hours; <5% road space; no functioning rail metro; LRT cancelled (2019).
- **Pollution** — air (PM2.5 ~50 µg/m³ — 5x WHO limit), water (Kelani River polluted), noise.
- **Garbage** — Meethotamulla collapse 2017 (~30 dead); waste-to-energy slow.
- **Public services** — schools overcrowded, hospitals (Colombo National Hospital, Lady Ridgeway) overburdened.
தீர்வுகள்:
- Decentralized employment — develop second-tier cities (Kandy, Galle, Hambantota, Jaffna, Anuradhapura) as alternatives.
- Affordable housing, rental housing policy.
- Mass public transport — restart LRT/Metro discussions, BRT, electrified rail.
- Solid waste — Aruwakkalu sanitary landfill, waste-to-energy.
- Urban green spaces, riverfront restoration (Kelani, Diyawanna).
- Telework + flexible work culture — reduce commute.
**(3) மாகாண சமச்சீரின்மை (Regional Imbalance):**
Western Province GDP = ~50% of national; North/East lag despite war end. Hill country estates declining.
தீர்வுகள்:
- **Northern + Eastern reconstruction** — Hambantota Port + Industrial Zone replicated. Mannar wind power, Jaffna fisheries, eastern tourism.
- **Hill country diversification** — beyond tea (organic cinnamon, eco-tourism, IT-BPO centers in Kandy/Nuwara Eliya).
- **Provincial autonomy + investment** — 13th Amendment full implementation; provincial budgets.
- **Rural connectivity** — broadband internet ("Smart Sri Lanka"), rural roads, postal banking.
- **Plantations modernization** — replant aging tea bushes, sustainable certification, worker housing improvement.
**(4) Female Middle East Migration Family Impact:**
~1+ million SL women (lifetime) worked Middle East. Despite economic benefit (remittances), social costs:
- **Children left behind** ("Middle East orphans") — raised by grandparents, fathers; behavioural issues, academic decline reported.
- **Marital separation strain** — divorce + extramarital affairs.
- **Worker abuse** — reports of sexual + physical abuse by employers (high-profile Rizana Nafeek 2013 execution).
- **Health issues** returning workers (TB, HIV, mental health).
- **Skill mismatch** — skilled women working as housemaids.
தீர்வுகள்:
- **Skilled migration shift** — train nurses, caregivers, IT for higher-skill higher-pay overseas markets (Japan, Korea, Italy).
- **Worker protection treaties** — bilateral agreements; SL embassies' active intervention.
- **Pre-departure training** — language, rights, contracts.
- **Family welfare programmes** — counselling, school support for left-behind children.
- **Domestic alternatives** — strong garment + plantation + service jobs domestically to reduce push.
- **Reintegration support** — returning workers business loans, skills training.
**(5) Other Concerns:**
- **Brain drain post-2022** — doctors, engineers, IT to Australia/Canada/EU. Healthcare + tech workforce thinning.
- **Skill mismatch** — A/L + degree holders without job-relevant skills; vocational training underrated.
- **Gender inequality** — female labour participation only ~35% despite 50% literacy + 60% university enrolment.
- **Inequality** — top 10% income share rising; Gini ~0.4.
🔥 மீட்டல் மையம்
பரீட்சைக்கு முன் இறுதி ஒரு நிமிடம் — மறக்கக்கூடாதவை மட்டும்.
- <b>2012 = 20.3M</b>; density 323/km²; first census 1871 = 2.4M.
- <b>1953 peak NI 2.8%</b> (malaria eradication DDT death rate↓).
- <b>2012 NI = 0.7%</b> (female ed + family planning); TFR ~2.0.
- <b>District extremes:</b> Colombo = highest pop (2.3M) + highest density (3438). Mullaitivu = lowest density (92).
- <b>Sector:</b> Rural 77.3% · Urban 18.2% · Estate 4.4%.
- <b>Ethnic:</b> Sinhala 74.9 · SL Tamil 11.2 · SL Moor 9.2 · Indian Tamil 4.2 · Others 0.5.
- <b>Religion:</b> Buddhist 70.2 · Hindu 12.6 · Islam 9.7 · Christian 7.4.
- <b>Age:</b> 0-14=25.6 · 15-59=62.2 · 60+=12.2.
- <b>Gender:</b> F 51.5% · M 48.5%.
- <b>Push:</b> unemployment, war, drought. <b>Pull:</b> jobs, education, peace.
- <b>Mahaweli planned resettlement:</b> ~1M wet→dry zone (1977+).
- <b>External migration:</b> Middle East 1.5M workers (60% female); diaspora 1M+ post-1983.
அலகின் முதுகெலும்பு — கருத்துக்களும் தொடர்புகளும்.
- <b>Census history:</b> 1871(2.4M) → 1901(3.6) → 1946(6.7) → 1953(8.1) → 1971(12.7) → 1981(14.8) → 2001(18.7) → 2012(20.3) → 2024(~22M est).
- <b>1953 peak causes:</b> Malaria eradication (DDT 1947-49 WHO+Rockefeller), antibiotics, vaccines, maternal+child health. DR 22→10/1000; BR stayed 37; NI 2.8%/yr = doubling 25 yrs.
- <b>Decline (1953→2012, 2.8%→0.7%):</b> Female literacy ~93% (S Asia highest); FHB 1965 + FPA 1953; voluntary contraception; marriage age 18→25+; urbanization; war emigration; TFR 5.5→2.0.
- <b>Provincial concentration:</b> Western 30% pop on 6% land. Northern 5% (lowest, post-war).
- <b>Districts (high pop):</b> Colombo 2.3M · Gampaha · Kurunegala · Galle. <b>Low pop:</b> Mullaitivu, Mannar, Vavuniya.
- <b>Ethnic distinction:</b> SL Tamils = N/E ancient (thousand+ yrs); Indian Tamils = 19th c British plantation labour upcountry estates; SL Moors = Arab+local descent, Tamil-speaking but distinct census ethnicity.
- <b>Religion-ethnicity correlation:</b> Sinhala≈Buddhist (some Christians); Tamil≈Hindu (some Catholic); Moor=Muslim.
- <b>Internal migration:</b> Rural→Urban (Colombo magnet). FTZ female workers Katunayake/Biyagama/Koggala. Mahaweli planned wet→dry.
- <b>External:</b> Middle East 1.5M-2M (Saudi/UAE/Kuwait/Qatar) ~60% female housemaids. Tamil diaspora Canada/UK/Australia/EU 1M+. Post-2022 crisis: 300K+ skilled emigrated Australia/Canada.
- <b>Remittances:</b> $5-7B/yr top FX source (often > apparel).
- <b>Aging:</b> 60+ 12.2(2012)→16(2024)→25(2040)→30(2050)%. EPF/ETF reform, healthcare, elderly care, retirement age challenges.
- <b>Urban congestion:</b> Colombo PM2.5 5xWHO; traffic 2h commute; housing crisis; Meethotamulla collapse 2017; LRT cancelled 2019.
- <b>Regional imbalance:</b> Western GDP 50%; N/E recovery; hill country decline. Solutions: decentralize, second-tier cities, provincial autonomy 13A.
- <b>Female migration impact:</b> "Middle East orphans"; marital strain; worker abuse; Rizana Nafeek 2013 execution. Solutions: skilled migration, worker protection, family welfare.
பரீட்சைக்கு முந்தின இரவு முழு அலகையும் ஓட்டிப் பார்.
- <b>Memorize numbers:</b> 20.3M (2012) · density 323 · TFR 2.0 · 1871 first census · 1953 peak 2.8% · 2012 NI 0.7%. Colombo 2.3M (highest) + 3438/km² (highest density). Mullaitivu 92/km² (lowest).
- <b>2012 percentages:</b> Sinhala 74.9 + Tamil 11.2 + Moor 9.2 + Indian Tamil 4.2; Buddhist 70.2 + Hindu 12.6 + Islam 9.7 + Christian 7.4; Rural 77.3 + Urban 18.2 + Estate 4.4; 0-14=25.6 + 15-59=62.2 + 60+=12.2; F 51.5 + M 48.5.
- <b>எளிதில் தவறும்:</b> (1) SL Tamil vs Indian Tamil distinction. (2) Sinhala % ≠ Buddhist % (some Sinhalese Christian). (3) Sector "Estate" 4.4% (not "Plantation"). (4) 1953 peak caused by death rate fall NOT birth rate rise. (5) Push (away) vs Pull (toward).
- <b>Mahaweli moved ~1M people</b> wet→dry zone; controversial Sinhalese resettlement in Tamil-majority East contributed to ethnic conflict.
- <b>Civil war 1983-2009 impact:</b> ~75K deaths, 800K+ displaced, ~1M Tamil diaspora abroad, demographic disruption.
- <b>கட்டுரைக்குத் தயார்:</b> (1) Growth history 1871-2012 + 1953 peak. (2) Distribution (provincial/district/ethnic/religion/age). (3) Internal+external migration. (4) Aging+urban+regional+female migration challenges + solutions.
- <b>Post-2022 brain drain</b> = doctors, engineers, IT to Australia/Canada/EU. Major concern.
- <b>SL stage in demographic transition:</b> Stage 3-4 transitional. Below replacement TFR. Aging like Thailand. Way ahead of Pakistan/Bangladesh (stage 2-3).